Download
1 / 10
100 likes | 203 Vues
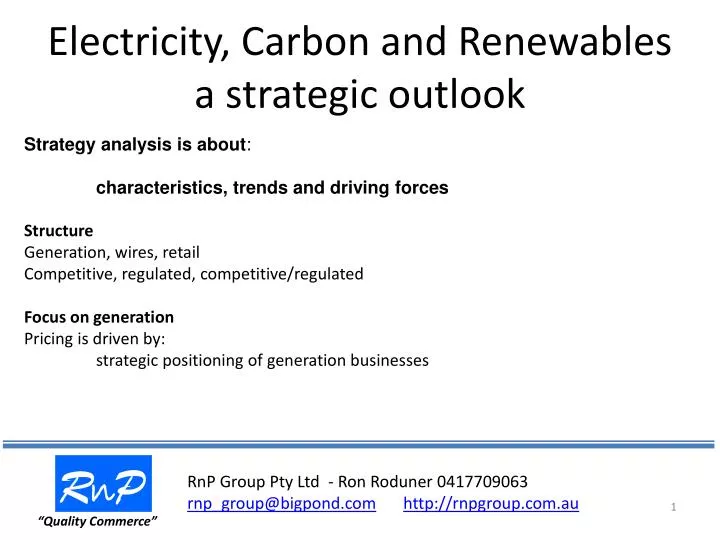
Electricity, Carbon and Renewables a strategic outlook. Strategy analysis is about : characteristics, trends and driving forces Structure Generation, wires, retail Competitive, regulated, competitive/regulated Focus on generation Pricing is driven by:

E N D
Electricity, Carbon and Renewables a strategic outlook Strategy analysis is about: characteristics, trends and driving forces Structure Generation, wires, retail Competitive, regulated, competitive/regulated Focus on generation Pricing is driven by: strategic positioning of generation businesses RnP RnP Group Pty Ltd - Ron Roduner 0417709063 rnp_group@bigpond.comhttp://rnpgroup.com.au “Quality Commerce”
Generation Strategic Drivers Vertical integration with fuel get inputs at production costs and not at market price Vertical integration with retail not permitted for govt corporations deliberate break up at corporatisation private players strive to vertical integration NSW saw the sales of coal mines To renew coal supply contracts, Generators face export parity, 3-4 times historical cost Gas industry structure is fundamental to driving generator input costs and customer prices RnP RnP Group Pty Ltd - Ron Roduner 0417709063 rnp_group@bigpond.comhttp://rnpgroup.com.au “Quality Commerce”
Generation Capital is the biggest cost Government cost of capital is lower than private and desired returns are less Fuel Coal leases held by governments Needs to be held for a long period for electricity and other infrastructure Government fuel sources developed by contractors so not inefficient Long term efficiency driven by fuel resource ownership and vertical integration Short term efficiency driven by competition to operate fuel resource Result Sourced fuel at production cost and not market price; a delinking of local fuel price from export pricing Achieved by most state governments until corporatisation strategic holdings reduce costs of supply of all infrastructure RnP RnP Group Pty Ltd - Ron Roduner 0417709063 rnp_group@bigpond.comhttp://rnpgroup.com.au “Quality Commerce”
Generation • Achievements • Zero or ½ CPI increases for 10 years prior to corporatisation • Strategic positioning now • Queensland coal generators well positioned • NSW saw the sales of coal mines • Generators face export parity, 3-4 times the historical fuel cost • Production cost $1/GJ; Export price $3-4/GJ ($30-40/MWh, doubles generation cost) • Gas is the new fuel and gas price reflective of export pricing • Gas supply industry structure has to be considered • Very few generators of scale vertically integrated into gas supply • The ones that are have a major cost advantage • First time in history for consumers that fuel will not be sourced at production cost but export market prices RnP RnP Group Pty Ltd - Ron Roduner 0417709063 rnp_group@bigpond.comhttp://rnpgroup.com.au “Quality Commerce”
Generation • Gas overview • Major campaigns to link local gas price to LNG (export) prices • Applies to gas resource owners that have generation assets • Indicative gas prices • Production cost $3/GJ • Incremental cost $1/GJ • Export market price $5-10/GJ • $5/GJ represents $40/MWh • Result • Major cost impost for customers • Increased profits and reduced risks for vertically integrated entities RnP RnP Group Pty Ltd - Ron Roduner 0417709063 rnp_group@bigpond.comhttp://rnpgroup.com.au “Quality Commerce”
Carbon To reduce carbon intensity, need to change the merit order from coal to gas Base load plant sets pool price and it must get its returns to remain viable Needs to be competitive on an incremental and total cost basis Coal Gas Fuel $10/MWh $40/MWh Carbon intensity 1t/MWh 0.5t/MWh Carbon cost $60/t $60/t Incremental cost $70/MWh $70/MWh Costs for illustrative purposes only Total cost changeover is similar Low carbon prices will not change merit order and will have limited ability to reduce emissions RnP RnP Group Pty Ltd - Ron Roduner 0417709063 rnp_group@bigpond.comhttp://rnpgroup.com.au “Quality Commerce”
Gas Costs Gas generators and suppliers compete in the regulatory arena and not the commercial arena Gas suppliers want to increase gas price as their product is more valuable $60/t is $3.75/GJ gas cost equivalent If gas supplier gets a 50% of the increase, then costs are: Coal Gas Fuel $10/MWh $55/MWh ($40/MWh) Carbon intensity 1t/MWh 0.5t/MWh Carbon cost $90/t $90/t ($60/t) Incremental cost $100/MWh $100/MWh ($70/MWh) Competition and pricing in the gas supply market is critical to managing fuel supply costs for non vertically integrated entities and electricity prices to customers RnP RnP Group Pty Ltd - Ron Roduner 0417709063 rnp_group@bigpond.comhttp://rnpgroup.com.au “Quality Commerce”
Gas Costs What are the alternatives? Volumes of gas to meet CPRS trajectories are unmet in historical terms and compete with LNG projects Gas is more expensive and regulation assists in securing a commercial return A carbon market penalises the fuel of choice and increases customer prices unnecessarily Regulatory intervention vs market pricing of carbon an alternative is to not impose a carbon price on all emissions but to limit use of unpopular technologies wrt emissions and to assist the use of preferred technologies RnP RnP Group Pty Ltd - Ron Roduner 0417709063 rnp_group@bigpond.comhttp://rnpgroup.com.au “Quality Commerce”
Gas vs Wind Some parties lobbying for an inclusive market with renewables Assume wind at $120/MWh and solar at $250/MWh Gas Wind Fuel $40/MWh $0/MWh Total cost $65/MWh $120/MWh Carbon intensity 0.5t/MWh 0.0t/MWh Carbon cost $110/t $0/t Total cost $120/MWh $120/MWh Solar? Neither are base load technologies so do not directly compete with gas RnP RnP Group Pty Ltd - Ron Roduner 0417709063 rnp_group@bigpond.comhttp://rnpgroup.com.au “Quality Commerce”
Conclusion Absolute need to separate markets Must consider some management by regulation Best to regulate rather than creating an artificial market Always has been major cost differences in technologies so separate the markets Market is simply a way to shadow price and hold costs up There is no technology on technology competition in baseload generation costs – never in history and not now Good reasons to manage costs differently than to put all technologies in the one size fits all carbon market RnP RnP Group Pty Ltd - Ron Roduner 0417709063 rnp_group@bigpond.comhttp://rnpgroup.com.au “Quality Commerce”