Download
1 / 3
30 likes | 169 Vues
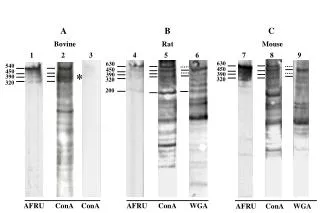
anti HPA antibodies. -. anti. HPA. Con A. Probe. GNA. MAM. SNA. EndoH. + - + - + -. CBB. GNA. (kDa). (kDa). (kDa). (kDa). 116. [80-130]. 97. 116. [80-130]. 97. 97. 66. 61. 58. 66. 61. 54. 58. 45. 54.

E N D
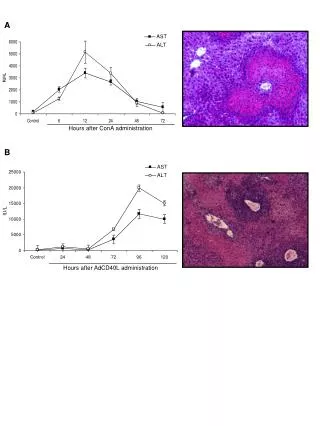
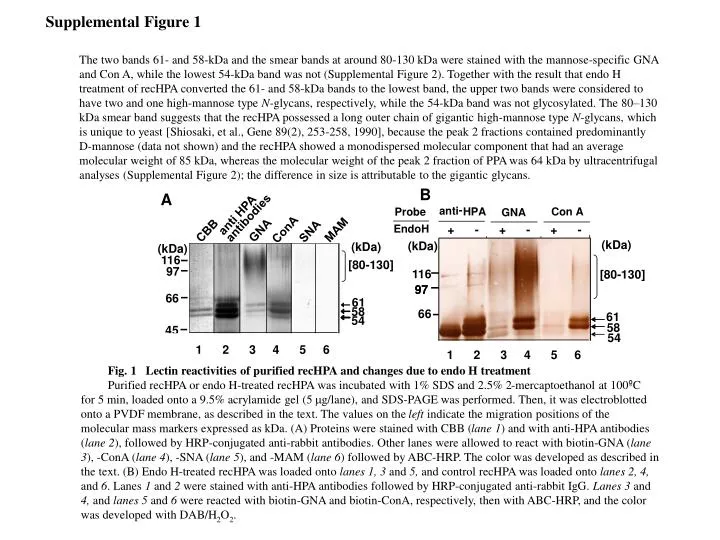
anti HPA antibodies - anti HPA Con A Probe GNA MAM SNA EndoH + - + - + - CBB GNA (kDa) (kDa) (kDa) (kDa) 116 [80-130] 97 116 [80-130] 97 97 66 61 58 66 61 54 58 45 54 1 2 3 4 5 6 1 2 3 4 5 6 Supplemental Figure 1 The two bands 61- and 58-kDa and the smear bands at around 80-130 kDa were stained with the mannose-specific GNA and Con A, while the lowest 54-kDa band was not (Supplemental Figure 2). Together with the result that endo H treatment of recHPA converted the 61- and 58-kDa bands to the lowest band, the upper two bands were considered to have two and one high-mannose type N-glycans, respectively, while the 54-kDa band was not glycosylated. The 80–130 kDa smear band suggests that the recHPA possessed a long outer chain of gigantic high-mannose type N-glycans, which is unique to yeast [Shiosaki, et al., Gene 89(2), 253-258, 1990], because the peak 2 fractions contained predominantly D-mannose (data not shown) and the recHPA showed a monodispersed molecular component that had an average molecular weight of 85 kDa, whereas the molecular weight of the peak 2 fraction of PPA was 64 kDa by ultracentrifugal analyses (Supplemental Figure 2); the difference in size is attributable to the gigantic glycans. B A ConA Fig. 1 Lectin reactivities of purified recHPA and changes due to endo H treatment Purified recHPA or endo H-treated recHPA was incubated with 1% SDS and 2.5% 2-mercaptoethanol at 100ºCfor 5 min, loaded onto a 9.5% acrylamide gel (5 mg/lane), and SDS-PAGE was performed. Then, it was electroblotted onto a PVDF membrane, as described in the text. The values on the left indicate the migration positions of the molecular mass markers expressed as kDa. (A) Proteins were stained with CBB (lane 1) and with anti-HPA antibodies (lane 2), followed by HRP-conjugated anti-rabbit antibodies. Other lanes were allowed to react with biotin-GNA (lane 3), -ConA (lane 4), -SNA (lane 5), and -MAM (lane 6) followed by ABC-HRP. The color was developed as described in the text. (B) Endo H-treated recHPA was loaded onto lanes 1, 3 and 5, andcontrol recHPA was loaded onto lanes2, 4, and 6. Lanes 1 and 2 were stained with anti-HPA antibodies followed by HRP-conjugated anti-rabbit IgG. Lanes 3 and 4, and lanes 5 and 6 were reacted with biotin-GNA and biotin-ConA, respectively, then with ABC-HRP, and the color was developed with DAB/H2O2.
B 0.02 0.00 -0.02 -0.04 recHPA 1.5 MW=101442 1.0 6.9 7.0 7.1 7.2 Supplemental Figure 2 A recHPA PPA recHPA D C Residuals Residuals PPA Absorbance Absorbance MW=64310 Radius Radius Fig. 2 Sedimentation velocity and equilibrium measurements of PPA and recHPA. Sampleswere loaded into the ultracentrifuge cells and centrifuged at 4ºC. Sedimentation velocity experiments were performed using PPA (A) and recHPA (B) solutions in 10 mM Tris-HCl (pH 7.2) containing 150 mM NaCl and 5 mM CaCl2 at a rotor speed of 45,000 rpm. The data were analyzed using a software program, Sedfit [Schuck, P. (1998) Biophys. J. 75, 1503-1512]. (C, D) Radial distribution of absorbance at equilibrium at 4,000 rpm for PPA (C) and recHPA (D). to obtain the distribution function of the apparent sedimentation coefficient, s; c(s). Sedimentation equilibrium experiments were performed at 4ºC at rotor speeds of 3,000, 4,000, and 5,000 rpm. Scans were recorded every 2 h, and the equilibrium of the system was judged by superimposition of the last three scans. The three datasets were globally fitted to a single species model to determine the weight average molecular weight using the ‘non-lin’ program preinstalled by the manufacturer. The density of the solvent, 1.00549 g/cm3, was calculated using the computer program SEDNTERP, and the partial specific volumes, 0.7253 (PPA) and 0.7188 (recHPA) cm3/g, were based on the amino acid and sugar compositions. Individual absorbance readings are shown by open circles, with solid lines through the data representing the fit to a single species model. The residuals for the fit are shown in the upper panel.
Supplemental Figure 3 Immunoprecipitation of SI (A) and SGLT1 (B) and membrane-binding studies with biotin-PPA were performed. Biotin-PPA was demonstrated to bind to both SI and SGLT1, and the bindings were almost abolished after N-glycosidase F treatment. For SGLT1, the intensity of staining with biotin-PPA was not intense, probably because SGLT1 located in lipid rafts of intestinal BBM has poor solubility in Triton X-100 [Guyon E. et. al. (2002) J. Cell Sci., 115, 713-724] and because the N-glycans of SGLT1 are mainly the multiantennary complex type which was predicted by the positive reactivity with L-PHA (our unpublished data), for which PPA has low affinity at neutral pH [Matsushita H. et al. (2002) J. Biol. Chem., 277, 4680-4686]. In spite of the faint staining, the binding of SGLT1 with biotin-PPA was clearly weakened after deN-glycosylation treatment, as shown by comparison between ‘C’ and ‘N-gly’. A. SI Silver Stain BBMP CN-gly anti-SI IgG BBMP CN-gly bio-PPA BBMP CN-gly bio-ConA CN-gly Silver Stain BBMP CN-gly anti-SGLT1 IgG BBMP CN-gly bio-PPA BBMP CN-gly bio-ConA CN-gly B. SGLT1 Fig. 3 Interaction between PPA and immunoprecipitated SI or SGLT1 before and after treatment with N-glycosidase F. Immunoprecipitation and Western blotting of SI (A) and SGLT1 (B) from the solubilized BBM to study binding activity with biotin-PPA. Rabbit anti-SI IgGs or rabbit anti-SGLT1 IgGs, Rabbit pre-immue IgGs were added to Dynabeads-protein G (Invitrogen), washed three times with TBS containing 0.1% Tween 20. Solubilized BBM were prepared at 5 mg/ml in TBS containing 0.1% TritonX-100 and centrifuged at 15,000 rpm for 10 min at 4oC. The immobilized Dynabeads-protein G was incubated with the BBM supernatantsat room temperature for 20 min, then washed three times with TBS containing 0.01% Tween 20 and boiled in 20 ml TBS containing 1 % SDS and 2.5 % b-mercaptoethanol. Each sample was treated with 5 U N-glycosidase F (Roche) at final concentration of 300 U/ml, 0.2% SDS, 0.5 % b-mercaptoethanol, 5 mM EDTA, and protease inhibitor (5 mM PMSF, 5 mM benzamidine, 4 mM e-aminocaproic acid , 100 U aprotinin) for 48 h at 37 oC, and then subjected to Western blotting. P: pre-immune rabbit IgG, C: control which was treated without N-glycosidase F, N-gly: N-glycosidase F-treated samples.