Download
1 / 69
740 likes | 1.2k Vues
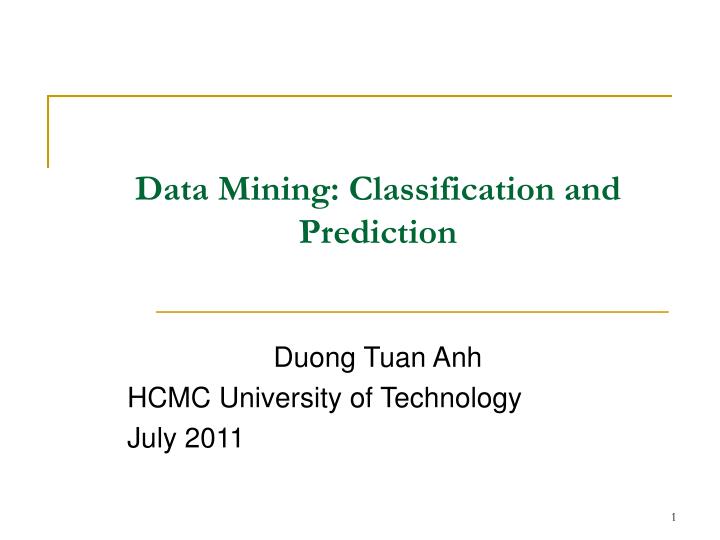
Data Mining: Classification and Prediction. Duong Tuan Anh HCMC University of Technology July 2011. Outline. 1. Classification with decision trees 2. Artificial Neural Networks. 1. CLASSIFICATION WITH DECISION TREES.

E N D
Data Mining: Classification and Prediction Duong Tuan Anh HCMC University of Technology July 2011
Outline • 1. Classification with decision trees • 2. Artificial Neural Networks
1. CLASSIFICATION WITH DECISION TREES • Classification is the process of learning a model that describes different classes of data. The classes are predetermined. • Example: In a banking application, customers who apply for a credit card may be classify as a “good risk”, a “fair risk” or a “poor risk”. Hence, this type of activity is also called supervised learning. • Once the model is built, then it can be used to classify new data.
The first step, of learning the model, is accomplished by using a training set of data that has already been classified. Each record in the training data contains an attribute, called the class label, that indicates which class the record belongs to. • The model that is produced is usually in the form of a decision tree or a set of rules. • Some of the important issues with regard to the model and the algorithm that produces the model include: • the model’s ability to predict the correct class of the new data, • the computational cost associated with the algorithm • the scalability of the algorithm. • Let examine the approach where the model is in the form of a decision tree. • A decision tree is simply a graphical representation of the description of each class or in other words, a representation of the classification rules.
Example 3.1 • Example 3.1: Suppose that we have a database of customers on the AllEletronics mailing list. The database describes attributes of the customers, such as their name, age, income, occupation, and credit rating. The customers can be classified as to whether or not they have purchased a computer at AllElectronics. • Suppose that new customers are added to the database and that you would like to notify these customers of an upcoming computer sale. To send out promotional literature to every new customers in the database can be quite costly. A more cost-efficient method would be to target only those new customers who are likely to purchase a new computer. A classification model can be constructed and used for this purpose. • The figure 2 shows a decision tree for the concept buys_computer, indicating whether or not a customer at AllElectronics is likely to purchase a computer.
Each internal node represents a test on an attribute. Each leaf node represents a class. A decision tree for the concept buys_computer, indicating whether or not a customer at AllElectronics is likely to purchase a computer.
Algorithm for decision tree induction Input: set of training data records: R1, R2, …, Rm and set of Attributes A1, A2, …, An Ouput: decision tree Basic algorithm (a greedy algorithm) - Tree is constructed in a top-down recursive divide-and-conquer manner - At start, all the training examples are at the root - Attributes are categorical (if continuous-valued, they are discretized in advance) - Examples are partitioned recursively based on selected attributes - Test attributes are selected on the basis of a heuristic or statistical measure (e.g., information gain)
Conditions for stopping partitioning - All samples for a given node belong to the same class - There are no remaining attributes for further partitioning – majority voting is employed for classifying the leaf - There are no samples left.
Procedure Build_tree(Records, Attributes); Begin (1) Create a node N; (2) If all Records belong to the same class, C then (3) Return N as a leaf node with the class label C; (4) If Attributes is empty then (5) Return N as a leaf node with the class label C, such that the majority of Records belong to it; (6) select attributes Ai (with the highest information gain) from Attributes; (7) label node N with Ai; (8) for each known value aj of Aido begin (9) add a branch for node N for the condition Ai = aj; (10) Sj = subset of Records where Ai = aj; (11) If Sj is empty then (12) Add a leaf L with class label C, such that the majority of Records belong to it and return L else (13) Add the node return by Build_tree(Sj, Attributes – Ai); end end
Attribute Selection Measure • The expected information gain needed to classify training data of s samples, where the Class attribute has m values (a1, …, am) and si is the number of samples belong to Class label ai is given by: I(s1, s2,…, sm) = - where pi is the probability that a random sample belongs to the class with label ai. An estimate of piis si/s. Consider an attribute A with values {a1, …, av } used as the test attribute for splitting in the decision tree. Attribute A partitions the samples into the subsets S1,…, Sv where samples in each Sihave a value of ai for attribute A. Each Si may contain samples that belong to any of the classes. The number of samples in Si that belong to class j can be denoted as sij. Entropy of A is given by: E(A) =
I(s1j,…,smj) can be defined using the formulation for I(s1,…,sm) with pi being replaces by pij = sij/sj. Now the information gain by partitioning on attribute A is defined as: Gain(A) = I(s1, s2,…, sm) – E(A). • Example 3.1: Table 1 presents a training set of data tuples taken from the AllElectronics customer database. The class label attribute, buys_computer, has two distinct values; therefore two distinct classes (m = 2). Let class C1 correspond to yes and class C2 corresponds to no. There are 9 samples of class yes and 5 samples of class no. • To compute the information gain of each attribute, we first use Equation (1) to compute the expected information needed to classify a given sample: • I(s1, s2) = I(9,5) = - (9/14) log2(9/14) – (5/9)log2(5/14) = 0.94
Training data tuples from the AllElectronics customer database Class No No Yes Yes Yes No Yes No Yes Yes Yes Yes Yes No
Next, we need to compute the entropy of each attribute. Let’s start with the attribute age. We need to look at the distribution of yes and no samples for each value of age. We compute the expected information for each of these distributions. For age =”<= 30”: s11 = 2 s21 = 3 I(s11, s21) = -(2/5)log2(2/5) – (3/5)log2(3/5)= 0.971 For age = “31…40” s12 = 4 s22 = 0 I(s12, s22) = -(4/4)log2(4/4) – (0/4)log2(0/4) = 0 For age = “>40”: s13 = 3 s23 = 2 I(s13, s23) = -(3/5)log2(3/5) – (2/5)log2(2/5)= 0.971 Using Equation (2), the expected information needed to classify a given sample if the samples are partitioned according to age is E(age) = (5/14)I(s11, s21) + (4/14) I(s12, s22) + (5/14)I(s13, s23) = (10/14)*0.971 = 0.694.
Hence, the gain in information from such a partitioning would be Gain(age) = I(s1, s2) – E(age) = 0.940 – 0.694 = 0.246 • Similarly, we can compute Gain(income) = 0.029, Gain(student) = 0.151, and Gain(credit_rating) = 0.048. Since age has the highest information gain among the attributes, it is selected as the test attribute. A node is created and labeled with age, and branches are grown for each of the attribute’s values. • The samples are then partitioned accordingly, as shown in Figure 3.
age? <= 30 >40 31…40 income student credit_rating class high no fair no high no excellent no medium no fair no low yes fair yes medium yes excellent yes income student credit_rating class medium no fair yes low yes fair yes low yes excellent no medium yes fair yes medium no excellent no income student credit_rating class high no fair yes low yes excellent yes medium no excellent yes high yes fair yes
Extracting Classification Rules from Trees • Represent the knowledge in the form of IF-THEN rules • One rule is created for each path from the root to a leaf • Each attribute-value pair along a path forms a conjunction • The leaf node holds the class prediction • Rules are easier for humans to understand. Example IF age = “<=30” AND student = “no” THEN buys_computer = “no” IF age = “<=30” AND student = “yes” THEN buys_computer = “yes” IF age = “31…40” THEN buys_computer = “yes” IF age = “>40” AND credit_rating = “excellent” THEN buys_computer = “no” IF age = “>40” AND credit_rating = “fair” THEN buys_computer = “yes”
1. NEURAL NETWORK REPRESENTATION • An ANN is composed of processing elements called or perceptrons, organized in different ways to form the network’s structure. Processing Elements • An ANN consists of perceptrons. Each of the perceptrons receives inputs, processes inputs and delivers a single output. The input can be raw input data or the output of other perceptrons. The output can be the final result (e.g. 1 means yes, 0 means no) or it can be inputs to other perceptrons.
The network • Each ANN is composed of a collection of perceptrons grouped in layers. A typical structure is shown in Fig.2. Note the three layers: input, intermediate (called the hidden layer) and output. Several hidden layers can be placed between the input and output layers. Figure 2
Appropriate Problems for Neural Network • ANN learning is well-suited to problems in which the training data corresponds to noisy, complex sensor data. It is also applicable to problems for which more symbolic representations are used. • The backpropagation (BP) algorithm is the most commonly used ANN learning technique. It is appropriate for problems with the characteristics: • Input is high-dimensional discrete or real-valued (e.g. raw sensor input) • Output is discrete or real valued • Output is a vector of values • Possibly noisy data • Long training times accepted • Fast evaluation of the learned function required. • Not important for humans to understand the weights • Examples: • Speech phoneme recognition • Image classification • Financial prediction
3. PERCEPTRONS • A perceptron takes a vector of real-valued inputs, calculates a linear combination of these inputs, then outputs • a 1 if the result is greater than some threshold • –1 otherwise. • Given real-valued inputs x1 through xn, the output o(x1, …, xn) computed by the perceptron is o(x1, …, xn) = 1 if w0 + w1x1 + … + wnxn > 0 -1 otherwise where wi is a real-valued constant, or weight. • Notice the quantify (-w0) is a threshold that the weighted combination of inputs w1x1 + … + wnxn must surpass in order for perceptron to output a 1.
To simplify notation, we imagine an additional constant input x0 = 1, allowing us to write the above inequality as n i=0 wixi >0 • Learning a perceptron involves choosing values for the weights w0, w1,…, wn. Figure 3. A perceptron
Representation Power of Perceptrons • We can view the perceptron as representing a hyperplane decision surface in the n-dimensional space of instances (i.e. points). The perceptron outputs a 1 for instances lying on one side of the hyperplane and outputs a –1 for instances lying on the other side, as in Figure 4. The equation for this decision hyperplane is Some sets of positive and negative examples cannot be separated by any hyperplane. Those that can be separated are called linearly separated set of examples. Figure 4. Decision surface
Perceptron training rule • Although we are interested in learning networks of many interconnected units, let us begin by understanding how to learn the weights for a single perceptron. • Here learning is to determine a weight vector that causes the perceptron to produce the correct +1 or –1 for each of the given training examples. • Several algorithms are known to solve this learning problem. Here we consider two: the perceptron training rule and the delta rule.
One way to learn an acceptable weight vector is to begin with random weights, then iteratively apply the perceptron to each training example, modifying the perceptron weights whenever it misclassifies an example. This process is repeated, iterating through the training examples as many as times needed until the perceptron classifies all training examples correctly. • Weights are modified at each step according to the perceptron training rule, which revises the weight wi associated with input xi according to the rule. wiwi + wi where wi = (t – o) xi • Here: t is target output value for the current training example o is perceptron output is small constant (e.g., 0.1) called learning rate
Perceptron training rule (cont.) • The role of the learning rate is to moderate the degree to which weights are changed at each step. It is usually set to some small value (e.g. 0.1) and is sometimes made to decrease as the number of weight-tuning iterations increases. • We can prove that the algorithm will converge • If training data is linearly separable • and sufficiently small. • If the data is not linearly separable, convergence is not assured.
Gradient Descent and the Delta Rule • Although the perceptron training rule finds a successful weight vector when the training examples are linearly separable, it can fail to converge if the examples are not linearly separatable. A second training rule, called the delta rule, is designed to overcome this difficulty. • The key idea of delta rule: to use gradient descent to search the space of possible weight vectors to find the weights that best fit the training examples. This rule is important because it provides the basis for the backpropagration algorithm, which can learn networks with many interconnected units. • The delta training rule: considering the task of training an un-thresholded perceptron, that is a linear unit, for which the output o is given by: o = w0+ w1x1 + ··· + wnxn (1) • Thus, a linear unit corresponds to the first stage of a perceptron, without the threhold.
In order to derive a weight learning rule for linear units, let specify a measure for the training error of a weight vector, relative to the training examples. The Training Error can be computed as the following squared error (2) where D is set of training examples, td is the target output for the training example d and od is the output of the linear unit for the training example d. Here we characterize E as a function of weight vector because the linear unit output O depends on this weight vector.
Hypothesis Space • To understand the gradient descent algorithm, it is helpful to visualize the entire space of possible weight vectors and their associated E values, as illustrated in Figure 5. • Here the axes wo,w1 represents possible values for the two weights of a simple linear unit. The wo,w1 plane represents the entire hypothesis space. • The vertical axis indicates the error E relative to some fixed set of training examples. The error surface shown in the figure summarizes the desirability of every weight vector in the hypothesis space. • For linear units, this error surface must be parabolic with a single global minimum. And we desire a weight vector with this minimum.
Figure 5. The error surface How can we calculate the direction of steepest descent along the error surface? This direction can be found by computing the derivative of E w.r.t. each component of the vector w.
Derivation of the Gradient Descent Rule • This vector derivative is called the gradient of E with respect to the vector <w0,…,wn>, written E . (3) Notice E is itself a vector, whose components are the partial derivatives of E with respect to each of the wi. When interpreted as a vector in weight space, the gradient specifies the direction that produces the steepest increase in E. The negative of this vector therefore gives the direction of steepest decrease. Since the gradient specifies the direction of steepest increase of E, the training rule for gradient descent is ww + w where (4)
Here is a positive constant called the learning rate, which determines the step size in the gradient descent search. The negative sign is present because we want to move the weight vector in the direction that decreases E. This training rule can also be written in its component form wiwi + wi where (5) which makes it clear that steepest descent is achieved by altering each component wi of weight vector in proportion to E/wi. The vector of E/wi derivatives that form the gradient can be obtained by differentiating E from Equation (2), as
(6) where xid denotes the single input component xi for the training example d. We now have an equation that gives E/wi in terms of the linear unit inputs xid, output od and the target value td associated with the training example. Substituting Equation (6) into Equation (5) yields the weight update rule for gradient descent.
(7) • The gradient descent algorithm for training linear units is as follows: Pick an initial random weight vector. Apply the linear unit to all training examples, them compute wi for each weight according to Equation (7). Update each weight wi by adding wi , them repeat the process. The algorithm is given in Figure 6. • Because the error surface contains only a single global minimum, this algorithm will converge to a weight vector with minimum error, regardless of whether the training examples are linearly separable, given a sufficiently small is used. • If is too large, the gradient descent search runs the risk of overstepping the minimum in the error surface rather than settling into it. For this reason, one common modification to the algorithm is to gradually reduce the value of as the number of gradient descent steps grows.
Figure 6. Gradient Descent algorithm for training a linear unit. (8) (9)
Stochastic Approximation to Gradient Descent • The key difficulties in applying gradient descent are: • Converging to a local minimum can sometimes be quite slow (i.e., it can require many thousands of steps). • If there are multiple local minima in the error surface, then there is no guarantee that the procedure will find the global minimum. • One common variation on gradient descent intended to alleviate these difficulties is called incremental gradient descent (or stochastic gradient descent). The key differences between standard gradient descent and stochastic gradient descent are: • In standard gradient descent, the error is summed over all examples before upgrading weights, whereas in stochastic gradient descent weights are updated upon examining eachtraining example. • The modified training rule is like the training rule given by Equation (7) except that as we iterate through each example we update the weight according to wi = (t – o) xi (10) where t, o and xiare the target value, unit output, and the ith input.
To modify the gradient descent algorithm in Figure 6 to implement this stochastic approximation, Equation wiwi + wiis simply deleted and Equation wi wi + (t - o)xi is replaced by wiwi + (t - o)xi. • We come to the stochastic gradient descent algorithm (Figure. 7)
Summing over multiple examples in standard gradient descent requires more computation per weight update step. On the other hand, because it uses the true gradient, standard gradient descent is often used with a larger step size per weight update than stochastic gradient descent. Figure 7. Stochastic gradient descent algorithm (11)
Stochastic gradient descent (i.e. incremental mode) can sometimes avoid falling into local minima because it uses the various gradient of E rather than overall gradient of E to guide its search. • Both stochastic and standard gradient descent methods are commonly used in practice. Summary • Perceptron training rule • Perfectly classifies training data • Converge, provided the training examples are linearly separable • Delta Rule using gradient descent • Converge asymptotically to minimum error hypothesis • Converge regardless of whether training data are linearly separable
3. MULTILAYER NETWORKS AND THE BACKPROPOGATION ALGORITHM • Single perceptrons can only express linear decision surfaces. In contrast, the kind of multilayer networks learned by the backpropagation algorithm are capaple of expressing a rich variety of nonlinear decision surfaces. • This section discusses how to learn such multilayer networks using a gradient descent algorithm similar to that discussed in the previous section. A Differentiable Threshold Unit • What type of unit as the basis for multilayer networks ? Perceptron : not differentiable -> can’t use gradient descent Linear Unit : multi-layers of linear units -> still produce only linear function Sigmoid Unit : smoothed, differentiable threshold function
Like the perceptron, the sigmoid unit first computes a linear combination of its inputs, then applies a threshold to the result. In the case of sigmoid unit, however, the threshold output is a continuous function of its input. • The sigmoid function (x) is also called the logistic function. • Interesting property: Output ranges between 0 and 1, increasing monotonically with its input. We can derive gradient decent rules to train One sigmoid unit Multilayer networks of sigmoid units Backpropagation
The Backpropagation (BP)Algorithm • The BP algorithm learns the weights for a multilayer network, given a network with a fixed set of units and interconnections. It employs a gradient descent to attempt to minimize the squared error between the network output values and the target values for these outputs. • Because we are considering networks with multiple output units rather than single units as before, we begin by redefining E to sum the errors over all of the network output units • E(w) = ½ (tkd – okd)2 (13) d D koutputs where outputs is the set of output units in the network, and tkd and okd are the target and output values associated with the kth output unit and training example d.
The Backpropagation Algorithm (cont.) • The BP algorithm is presented in Figure 8. The algorithm applies to layered feed-forward networks containing 2 layers of sigmoid units, with units at each layer connected to all units from the preceding layer. • This is an incremental gradient descent version of Backpropagation. • The notation is as follows: • xij denotes the input from node i to unit j, and wij denotes the corresponding weight. • n denotes the error term associated with unit n. It plays a role analogous to the quantity (t – o) in our earlier discussion of the delta training rule.
Figure 8. The Backpropagation algorithm (14) (15) (16)
In the BP algorithm, step1 propagates the input forward through the network. And the steps 2, 3 and 4 propagates the errors backward through the network. • The main loop of BP repeatedly iterates over the training examples. For each training example, it applies the ANN to the example, calculates the error of the network output for this example, computes the gradient w. r. t. the error on the example, then updates all weights in the network. This gradient descent step is iterated until ANN performs acceptably well. • A variety of termination conditions can be used to halt the procedure. • One may choose to halt after a fixed number of iterations through the loop, or • once the error on the training examples falls below some threshold, or • once the error on a separate validation set of examples meets some criteria.
Adding Momentum • Because BP is a widely used algorithm, many variations have been developed. The most common is to alter the weight-update rule in Step 4 in the algorithm by making the weight update on the nth iteration depend partially on the update that occurred during the (n -1)-th iteration, as follows: (18) • Here wi,j(n) is the weight update performed during the n-th iteration through the main loop of the algorithm. • - n-th iteration update depend on (n-1)th iteration • - : constant between 0 and 1 is called the momentum. • Role of momentum term: • - keep the ball rolling through small local minima in the error surface. • - Gradually increase the step size of the search in regions where the gradient is unchanging, thereby speeding convergence.
Derivation of the Backpropagation Rule Recall from the equation: Ed(w) = (1/2)(td – od)2 (11) Stochastic gradient descent involves iterating through the training examples one at a time. In other words, for each training example d, every wji is updated by adding to it ji: (21) where Ed is the error on training example d, summed over all ouput units.
Notation • xji = the ith input to unit j • wji = the weight associated with the ith input to unit j • netj = i wjixji (the weighted sum of input for unit j) • oj = the output computed by unit j • tj = the target output for unit j • = the sigmod function • outputs = the set of units in the final layer of the network • Downstream(j) = the set of units whose immediate inputs include the output of unit j. Now we derive an expression for Ed/ wji in order to implement the stochastic gradient descent rule in Equation (21).
To begin, notice that weight wji can influence the rest of the network through netj. So, we can use the chain rule to write: (22) Now our remaining task is to derive a convenient expression for Ed/ netj. We consider two cases: (1) the case where unit j is an output unit and (2) the case where j is an internal unit.
Case 1: Training rule for output unit weights. • Just as wji can influence the rest of the network only through netj, netj can influence the network only through oj. So, we can use the chain rule again to write: (23) To begin, consider the first term in Equation (23) The derivatives in the right hand side will be zero for all output units k except when k = j.