Download
1 / 65
700 likes | 1.27k Vues
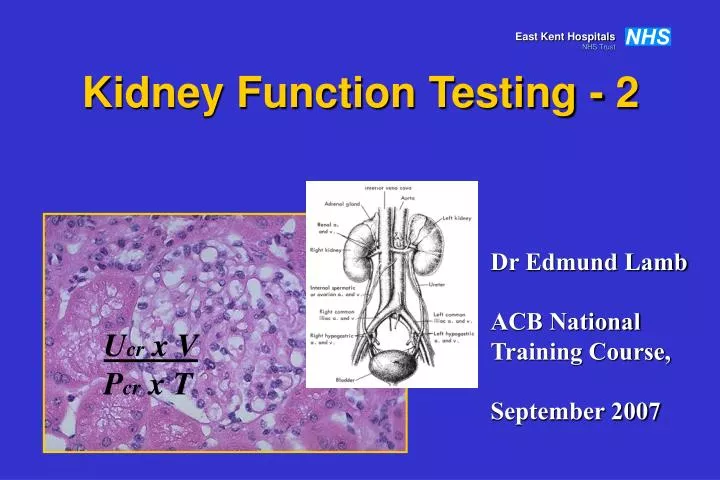
Kidney Function Testing - 2. Dr Edmund Lamb ACB National Training Course, September 2007. U cr x V P cr x T. Overview. Part one Classification of CKD GFR Creatinine and eGFR Part two Cystatin C Proteinuria/albuminuria. Cystatin C. 13 kD basic protein 120 AAs, single pp. chain

E N D
Kidney Function Testing - 2 Dr Edmund Lamb ACB National Training Course, September 2007 Ucr x V Pcr x T
Overview Part one • Classification of CKD • GFR • Creatinine and eGFR Part two • Cystatin C • Proteinuria/albuminuria
Cystatin C • 13 kD basic protein • 120 AAs, single pp. chain • cysteine-protease inhibitor • produced at constant rate by all nucleated cells • freely filtered at glomerulus • reabsorbed/catabolised in proximal tubule • serum concentration mainly determined by GFR • proposed as improved GFR marker • ? especially useful in moderate CKD
4 3 2 1 0 <30 31-40 41-50 51-60 61-70 71-80 81-90 91-100 101-110 111-120 >120 CKD: sensitivityto nephron loss 206 nephrology out-patients with SCr <300 umol/L Cystatin C Proportional increase in analyte Creatinine ** ** * * EDTA GFR (ml/min/1.73 m2) Newman et al KI 1995
Sensitivity in older people 53 patients, mean age 80 y O’Riordan et al 2003
Cystatin C reflects GFR in children Newman, Ann Clin Biochem 2002
Other settings • CKD (numerous studies) • Paediatrics (numerous studies) • Renal Tx monitoring (Le Bricon et al Clin Chem 1999) • Chemotherrapy monitoring (Stabuc et al Clin Chem 2000) • Pre-eclampsia (Strevens et al BJOG 2003) • Type 2 diabetes (Mussap et al KI 2002) • Spinal cord injury (Jenkins et al Ann Clin Biochem 2003) • Renovascular disease (Olivieri et al Clin Chem 2002) • Myeloma (Lamb et al 2004) • Rheumatoid arthritis on NSAIDs (Mangge et al CCA 2000) All demonstrate benefits c.f. creatinine
ROC Meta-Analysis ROC curve analysis of relative diagnostic accuracy 20 studies included AUC Cystatin C = 0.95 AUC Creatinine = 0.91 P=0.003 Laterza et al 2002
p<0.001 META-ANALYSIS Serum Cystatin C Is Superior to Serum Creatinine as a Marker of Kidney Function Also, PENIA studies (r=0.846) better than PETIA studies (r=0.784) Dharnidharka et al 2002 1/CysC 1/Creat p<0.001 1/CysC 1/Creat p<0.001
Measurement of cystatin C • Measured by immunoassay • No international standard. • Generally free from spectral interferences (haemolysis, icterus, lipaemia) ? Effects of rheumatoid factor • Precision as good as creatinine • Cost £2-£3
Possible caveats • Malignant progression • Thyroid disease • Biological variation
Malignant progression Suggested up-regulation of cystatin C in tumour progression BUT, didn’t present renal function data (other than “creatinines equivalent”)! Kos et al 1998
Malignant progression • Expression of cystatin C has been observed in human lung and colon cancer cell lines • Cathepsins (which cystatin C inhibit) implicated in a variety of models of malignant progression But, to date: • Multiple myeloma - no evidence of effect (Lamb et al 2004) • Multiple myeloma – no evidence of effect (Finney et al 2001) • Proliferative haematological disorders - no evidence of effect (Mojiminiyi et al 2002)
Thyroid function and cystatin C Discrepancy between GFR assessed by creatinine and cystatin C (BUT, no gold standard GFR used) Jayagopal et al 2003
Thyroid function “Cystatin C should not be used without knowledge of thyroid status” (BUT, no gold standard GFR used) den Hollander et al 2003
Biological variability and cystatin C • Healthy volunteers • Cystatin C better as a screening test than creatinine • Creatinine better for following changes in an individual patient • Children with CKD • Total variability (analytical + biological) • Cystatin C 12%, creatinine 13% (p=0.0012) Keevil et al 1998 Sambasivan et al 2005
Monitoring function over time • 20 Pima Indians with type 2 diabetes • All hyperfiltering • Iothalamate GFR over 4 years • Cystatin C • MDRD • C&G Perkins et al 2005
Monitoring function over time Perkins et al 2005
Cystatin C can predict GFR • 536 adults and children • Iohexol gold standard • GFR = 84.69 x cystatin C-1.680 [ x 0.948 if female] • R2 = 0.868, median bias 1.9%, within 30% =82% • Estimation superior/equivalent to MDRD • R2 = 0.846, median bias 0.02%, within 30% =79% • (Also better than Counahan-Barrat, Schwartz) Grubb et al 2005
Summary – cystatin C • Cystatin C detects CKD earlier than creatinine • It more sensitively predicts earlier complications of CKD • We need better markers of GFR • If we are really serious about early detection (and management) of CKD, then cystatin C may find a place • Possible roles – Tx monitoring, paediatric nephrology, pregnancy
History of proteinuria • Hippocrates (400 bc) noted association between bubbles on surface of urine and kidney disease • Richard Bright (1827), Guy’s Hospital, London discovered that oedema and proteinuria linked with renal disease – Bright’s disease (albuminous nephritis). • Detected protein by boiling urine until white precipitate appeared
Proteinuria is the strongest predictor of progressive disease Progression to ERF per tertile of protein excretion GISEN study, KI 1998
…Independently of hypertension GISEN study, KI 1998
‘Clinical’ proteinuria • Normal protein excretion <150 mg/day (of which albumin about 30 mg, THG predominates) • Proteinuria typically considered present when ‘1+’ on disptick • Equivalent to approx 300 mg/L or 500 mg/day (0.5 g/day)
“Proteinuria can be assessed from a single urine sample (preferably an EMU)…24 h urine collections are therefore unnecessary for this”
Protein:creatinine ratio and 24 h proteinexcretion are closely related Ginsberg (NEJM 1983) – proposed 24 h urine collections could be replaced by PCR ratios Ruggenenti et al (1998) study of 177 non-diabetic patients with nephropathy
…also showed that the ratio (r=-0.40) is a better predictor of progression than 24 h excretion (r=-0.27) Ruggenenti et al 1998
Protein:Creatinine Ratios “The protein:creatinine ratio on a random urine specimen provides evidence to rule-out the presence of significant proteinuria as defined by a 24 h urine excretion measurement” Systematic review.Price et al, Clin Chem September 2005
Protein:Creatinine Ratios • Assumptions: normal volume 1.5 L/24 h, normal creatinine excretion 10 mmol/24 h • ‘Normal’ protein excretion often considered <150 mg/24 h • ‘1+’ on a dipstick = 300 mg/L or 450 mg/24 h • Therefore, ‘normal’ becomes <15 mg/mmol and ‘1+’ becomes 45 mg/mmol
Protein:Creatinine Ratios (2) • correct for urinary dilution/concentration • easier • cheaper • more acceptable to the patient • closely predict 24 h excretion • consistent with guidelines (K-DOQI, PARADE, NSF) • more accurately predict progression …but require re-education in interpretation
Classification of proteinuria • Glomerular • Tubular • Overflow Quantitatively and clinically, glomerular proteinuria is most significant
Glomerular proteinuria • The glomerulus is a filter, retaining proteins of Mr > approximately 65 kDa (e.g. albumin) • Therefore the appearance of high Mr proteins in urine implies glomerular damage • May be selective (mainly albumin) or unselective (larger proteins e.g. IgG) – classification rarely used • In most conditions, albumin is quantitatively the most significant protein
Total protein versus albumin • Proteinuria is predominantly albuminuria, but there is not a linear relationship between the two: • 150 mg/L TP contains 30 mg/L albumin (20%) • 300 mg/L TP contains 150 mg/L albumin (50%) • 1000 mg/L TP contains 700 mg/L albumin (70%) • Relationship more variable at low protein concentrations • TP stick tests and laboratory methods particularly sensitive to albumin
Renal handling of albumin • r=3.6 nm, filtration fraction <0.01 (cf dextran of same r=0.1) • pI 4.7 – highly anionic – repulsed by glomerular polyanion • 37,000 g/day pass through glomerular capillaries, • 1.3 g/day pass into urinary space (0.004%) • Where is the barrier to filtration?
The filtration barrier The glomerular basement membrane is a size- and charge-selective filter Foot processes are the final barrier to filtration
(A) Healthy (B) MCN MCN associated with flattening (effacement) of the foot processes in scanning EM Mathieson, Clin Sci 2004;107:533-8
Renal handling (2) – post glomerular • 1.3 g pass into urinary space (0.004% of handled) • Approx 10-30 mg/day passed in urine (<1% of filtered) • What happens to the remainder?
TUBULAR LUMEN Cub 1.3 g/day Amn Cub Albumin 66,000 Da Meg Meg Meg Endosome Returns to circulation 10 mg/day Lysosome 500-15,000 Da fragments Lost in urine (only intact albumin measured) 35% 65%
Urinary albumin/‘microalbuminuria’ • 1963 - Keen & Chlouverakis @ Guy’s developed immunoassay for low concentrations of urine albumin • Such immunoassays can detect increased albumin in urine before clinical proteinuria is detectable • 1982 - Viberti et al @ Guy’s coined term “microalbuminuria” “An increase in the urinary excretion of albumin above the reference range for healthy non-diabetic subjects but at a level not detectable by crude clinical tests (protein stix tests)” ‘Microalbuminuria’ is common in diabetes mellitus and predicts progression to ESRD
NOTE!!! • ‘microalbuminuria’ is not about a small form of albumnin • ‘microalbuminuria’ is about increased, not decreased, amounts of albumin in the urine
Microalbuminuria and progression • mid-1980's - studies showed that microalbuminuria predicted development of clinical nephropathy in diabetic patients and that good control slowed progression (e.g. Kroc study) but studies were small/too short • 1990’s - good glycaemic control prevents progression to microalbuminuria (DCCT, n>1400) and effect persists (‘metabolic memory’ – EDIC) - antihypertensive medication in patients with micro- (& macro-) albuminuria may delay progressive loss of glomerular filtration - association with other disease (e.g. CVD) appreciated, both in diabetics and non-diabetics (e.g. PREVEND) In diabetes, microalbuminuria has become established as a marker of potentially treatable disease
Confounding factors • Biological variation (day-to-day CV 45%) • Metabolic control • Intercurrent illness (e..g. sepsis, post-myocardial infarction, surgery, SIRS) • Haematuria/menstrual contamination • Non-diabetic renal disease • Uncontrolled hypertension • Strenuous exercise • Urinary tract infection Microalbuminuria should be present in at least two out of three urine samples preferably collected within a 6(1) month period in the absence of ketonuria or infection
Microalbuminuric ranges Overnight AER 20-200 ug/min [seen as ‘gold standard’ method] equivalent to: 30-300 mg/24 h [or 20-200 mg/L (NICE)] which if you excrete 10 mmol creatinine/day is equivalent to: 3.0 – 30 mg/mmol creatinine [or 30-300 ug/mg in US] or: Males 2.5 mg/mmol, Females 3.5 mg/mmol
Natural history of diabetic renal disease 10-15 y 10-20 y
PREVEND (1) • 40,000/85,000 residents of Groningen recruited in 1997 • Urine albumin measured • Followed for 3 y • 516 deaths • Mortality and cause of mortality recorded Hillege et al, JIM 2001, Circulation 2002
PREVEND (2) • Microalbuminuria present in 7.2% of population • Independently associated with hypertension, diabetes, CV disease • After excluding diabetics and hypertensives, microalbuminuria still present in 6.6% of population.
PREVEND (3) • Increasing albuminuria associated with increasing CV and, to a lesser extent, non-CV mortality (esp. cancer) • Albuminuria is a strong predictor of all cause mortality in general popn. • Risk begins at levels not considered microalbuminuric • (Similar data from Framingham Offspring Study on non-diabetic, non-HT subjects [Arnlov et al, Circulation 2005])