Download
1 / 29
310 likes | 549 Vues
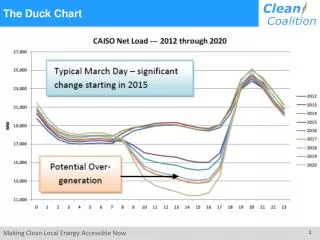
Teaching The Duck To Fly. Pacific Northwest Demand Response Project Portland, Oregon January 23, 2014. Jim Lazar RAP Senior Advisor. January 23, 2014. The California ISO “Duck Curve”: Increasing solar means steep afternoon ramping. What Causes This Challenge?.

E N D
Teaching The Duck To Fly Pacific Northwest Demand Response Project Portland, Oregon January 23, 2014 Jim Lazar RAP Senior Advisor January 23, 2014
The California ISO “Duck Curve”:Increasing solar means steep afternoon ramping.
What Causes This Challenge? Variable Loads: we’ve had those forever. Wind: Variable supply. Solar: Predictably NOT available for late PM peak demand.
Guess What: Ducks Can Fly A duck in water has very much the shape of the CAISO graphic. The “fat body” floats, and the tall neck breathes. A duck in flight stretches out its body and straightens its neck in order to reduce wind resistance. Our job is to straighten this duck out.
Ten Strategies To Align Loads to Resources(and Resources to Loads) with Illustrative Values for Each • Targeted energy efficiency • Orient solar panels • Use solar thermal with storage. • Manage electric water heat • Require new large air conditioners to include storage • Retire older inflexible power plants • Concentrate demand charges into “ramping” hours • Deploy energy storage in targeted locations • Implement aggressive demand response programs • Use inter-regional exchanges of power Not every strategy will be applicable to every utility.
Our Starting Point:A California Utility’s Projected “Duck” 4,000 MW Peak Demand; 2,000 MW Minimum Demand; 73% Load Factor; Max 1-hour ramp: 400 MW Forecast: 2,500 MW of wind and solar added 2012 – 2020; Predicted 63% Load Factor; Max 1-hour ramp: 550 MW
Strategy 1: Targeted Energy Efficiency Focus efforts on EE measures with afternoon peak orientation. 5% of total usage by 2020; 3:1 ratio between on-peak and off-peak savings. Kitchen lighting is a great example.
Strategy 1: Targeted Energy Efficiency Focus efforts on EE measures with afternoon peak orientation.
Strategy 2: Orient Solar Panels to the West Fixed-axis solar panels produce a more valuable output if oriented to the West. 100 MW shift out of AM into PM hours, out of ~700 total rooftop solar assumed. 6 PM
Strategy 3: Use Solar Thermal In Place of Some Solar PV Solar thermal energy is more expensive, but can be stored for a few hours at low cost. Substitute 100 MW of solar thermal for 100 MW of utility-scale PV, out of 1,500 MW of utility-scale solar total assumed.
Strategy 4: Control Electric Water Heating Install grid control of electric water heating; Supercharge during low-cost hours. Illustrative utility has ~12% of state load; assume it can gain control over 5% of the electric water heaters in the state, for 300 MWh of load shifting.
Strategy 5: Require 2-hour Storage On New AC Require new AC units over 5 tons to include at least 2 hours of storage, under grid control. Move 100 MWh of AC load out of the 6 – 8 PM period into off-peak periods.
Strategy 6: Retire Older Inflexible Generating Plant Older steam plants with night minimum loads and slow ramping are being replaced with gas “flex” units that ramp quickly. GE Flex Combined Cycle Unit
Strategy 6: Retire Older Inflexible Generating Plant No specific change attributed; assumed to be embedded in the 2020 forecast from the sample utility.
Strategy 7: Concentrate Demand Charges Concentrate utility prices into the “ramping” hours; hourly rates for large-volume customers. New Rate $10/month $2/kW non-coincident $12/kW 4PM – 7 PM $.06/kWh off-peak $.10/kWh mid-peak $.25/kWh on-peak Old Rate $10/month $10/kW $.10/kWh
Strategy 8: Deploy Electrical Storage Selectively charge electric vehicle batteries; Add grid battery storage at strategic locations that help avoid T&D upgrade costs. Storage equal to 1% of total load added. 100 MW capacity system-wide assumed.
Strategy 9: Demand Response Contract with customers for curtailment on an as-needed basis when the ramp is steep. 3% curtailment of peak demand on high-ramp days. Currently ~8% at NEISO.
Strategy 10: Inter-regional Power Exchanges Take advantage of geographical diversity of loads, and geographical diversity of output from renewable resources. Exchange 600 MWh per day from early to late evening using the existing inter-regional interties to Arizona, Nevada, Utah, and the Northwest
Strategy 10: Inter-regional Power Exchanges This duck is ready to spread his wings and fly.
How Did We Do? Pre-Strategy, without Solar/Wind: 73% LF Pre-Strategy, with Solar/Wind: 63% LF Post-Strategy, with Solar/Wind: 83% LF Hourly Ramp: 340 MW vs. 400 today, and 550 w/o strategies
Teaching the Duck to Fly Requesting Permission for Take-Off
jlazar@raponline.org The Paper can be downloaded from: http://www.raponline.org/document/download/id/6977