Download
1 / 26
260 likes | 356 Vues
A Stategy for Predicting Climate Sensitivity Using Satellite Data Daniel B. Kirk-Davidoff University of Maryland Department of Meteorology dankd@atmos.umd.edu. Talk Structure Background on the Fluctuation Dissipation Theorem Experiments using a Toy Model Model Description Results

E N D
A Stategy for Predicting Climate Sensitivity Using Satellite Data Daniel B. Kirk-Davidoff University of Maryland Department of Meteorology dankd@atmos.umd.edu
Talk Structure • Background on the Fluctuation Dissipation Theorem • Experiments using a Toy Model • Model Description • Results • An additional complication • Preliminary model-data comparison exercise • Conclusions
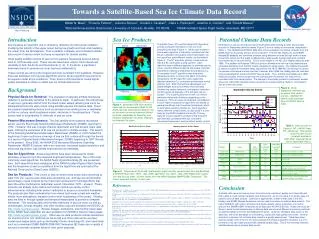
The Fluctuation Dissipation Theorem As discussed in Leith (1975), the Fluctuation Dissipation theorem states that the infinitessimal impulse-response tensor g(t’) is equal to the lag covariance matrix of the response lag t’, divided by its variance. Climate change Typically, the FDT is used to derive macroscopic properties of a system from a theoretical model of its statistical properties. Here, the hope is that by measuring rapid fluctuations over a relatively short time, we can derive the long-term climate sensitivity of a model, or of the real world. Climate forcing Time over which Uis different from zero
Derivation Starting from a simple stochastic differential equation: It’s not hard to see that the lag autocorrelation should fall off exponentially: From which it follows that: It turns out, though, that we get better results by integrating both sides of the second equation,since this averages over a lot of noise:
Variations on FDT 1. Cionni et al.’s variation: 2. Our variation:
Toy Model • We next construct a half-dimensional toy model, with only surface and atmospheric heat budgets, and a gray atmosphere. • The model can be run very quickly (10 seconds for 20 years of model time on a laptop computer under MATLAB). • The model sensitivity can be varied by making either the atmospheric emissivity or the surface albedo functions of temperature, vaguely analogous to a water vapor or ice-albedo feedback, respectively. • We force the model with AR1 noise applied to either the solar constant or the emissivity (anologous to CO2 forcing), and compare sensitivities derived using the Fluctuation-Dissipation Theorem with the true climate sensitity, easily found by running the model to equilibrium.
Toy Model Variables Cs, Casurface and atmospheric heat capacity Ts, Tasurface and atmospheric temperature albedo Stefan-Boltzmann constant atmospheric longwave emissivity base emissivity 0forced emissivity Satmospheric short wave absorptivity S00 solar constant S0 variable insolation ff feedback parameters for albedo and longwave emissivity AAR1 noise, scaled to zero mean, standard deviation 1. cA AR1 noise parameter r Random noise, flat distribution 0-1
Toy Model Equations Surface, atmospheric Energy budgets. Feedbacks on albedo and emissivity Forcing of emissivity and insolation Generation of AR1 noise
Equilibrium Climate Sensitivity for a range of parameter values
Model Response for Various Heat Capacities
Toy Model Results • For sufficiently small heat capacity or sufficiently long time series, FDT-based methods gives excellent predictions of the relative magnitude of model sensitivity. • The length of the time series necessary for an accurate prediction of sensitivity is comparable to the model’s equilibration time scale for a given heat capacity.
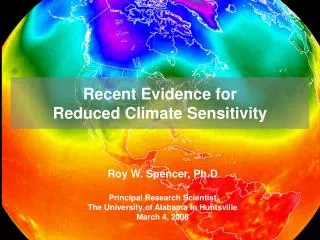
Preliminary model-data comparison • We look at a forced (1% /year increase in CO2) run of NCAR CCSM 2.0 • Use FDT to derive local sensitivity using CO2 data. • Compare to “sensitivity” derived from surface temperature and TOA solar forcing. • Compare this to result for NCEP data. • Future: use IR radiances from multiple channels of AIRS data.
Conclusions • The FDT or related measures based on lag-covariances give accurate predictions of model sensitivity for a broad range of feedback and forcing types. • The length of the time series required for accurate computation of model sensitivity increases with the time scale for the approach to equilibrium, though this relationship becomes complicated when multiple surface heat capacities are involved. Thus these measures are likely to be useful as a short-cut to evaluating a model’s climate sensitivity. • However, our results confirm that lag covariances are intimately connected to climate sensitivity. This suggests that metrics involving lag covariance of surface temperature and TOA radiative fluxes could be a very powerful metric by which to compare models and data, and thus to estimate the climate system’s true sensitivity to radiative forcing.
References Bell, T.L., 1980: Climate sensitivity from fluctuation dissipation: Some simple model tests. J. Atmos. Sci., 37: 1700–1707. Chou, M.-D., M. J. Suarez, X.-Z. Liang, M. M.-H. Yan, 2001. A thermal infrared radiation parameterization for atmospheric studies. NASA Technical Memorandum 104606, vol. 19, 65 pp. Available at (http:// climate.gsfc.nasa.gov/ chou/clirad_lw). Cionni, I., G. Visconti, and F. Sassi, 2004. Fluctuation dissipation theorem in a general circulation model. Geophys. Res. Letts., 31:L09206, doi: 10.1029/2004GL019739 Emanuel, K.A., 1991: A scheme for representing cumulus convection in large-scale models. J. Atmos Sci.,48: 2313-2335. Model code updated by the author in 1997, available at ftp://texmex.mit.edu/pub/emanuel/CONRAD. Haskins, R.D., R.M. Goody, L. Chen, 1997: A statistical method for testing a general circulation model with spectrally resolved satellite data. J. Geophys. Res., 102:16,563–16,581. Kirk-Davidoff, D.B., 2005: Diagnosing Climate Sensitivity Using Observations of Fluctuations in a Model with Adjustable Feedbacks. Submitted to J. Geophys. Res. Leith, C.E., 1975: Climate response and fluctuation dissipation. J. Atmos. Sci., 32: 2022–2026. Acknowledgements This work was inspired by conversations with John Dykema, Jim Anderson, Richard Goody and Brian Farrell. It was made possible by start-up funds provided by the University of Maryland