Download
1 / 1
10 likes | 132 Vues
Child ZAP – child scales Entire group (n=488) Chi-Square = 306.856 (74 df; p=,000) CFI = .964; TLI = .955 RMSEA = .081 (95% CI = .071 - .090) SMR = 0.032 Standardized estimates. .76. ChInt1. e 1 . .87. .72. ChInt2. e2. .85. .69. ChInt3. e3. .83. ChINT. .83. .69. ChInt4. e4 .

E N D
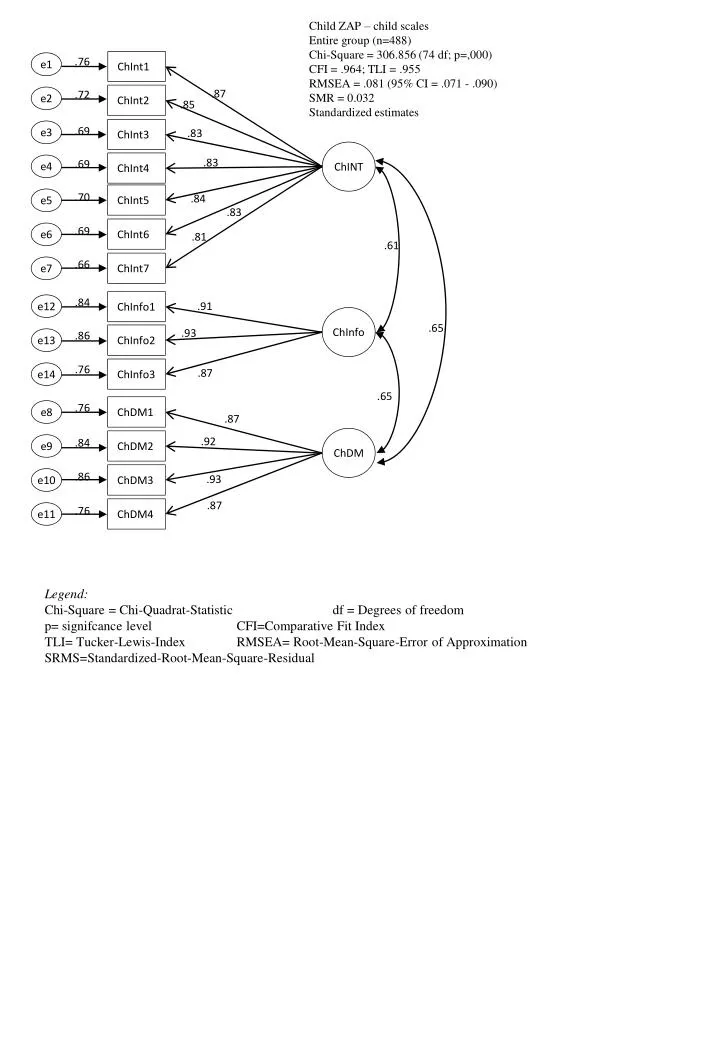
Child ZAP – child scales Entire group (n=488) Chi-Square = 306.856 (74 df; p=,000) CFI = .964; TLI = .955 RMSEA = .081 (95% CI = .071 - .090) SMR = 0.032 Standardized estimates .76 ChInt1 e1 .87 .72 ChInt2 e2 .85 .69 ChInt3 e3 .83 ChINT .83 .69 ChInt4 e4 .70 ChInt5 .84 e5 .83 .69 ChInt6 e6 .81 .61 .66 ChInt7 e7 .84 ChInfo1 .91 e12 ChInfo .65 .93 .86 ChInfo2 e13 .76 ChInfo3 .87 e14 .65 .76 ChDM1 e8 .87 ChDM .92 .84 ChDM2 e9 .86 ChDM3 .93 e10 .87 .76 ChDM4 e11 Legend: Chi-Square = Chi-Quadrat-Statistic df = Degrees of freedom p= signifcance level CFI=Comparative Fit Index TLI= Tucker-Lewis-Index RMSEA= Root-Mean-Square-Error of Approximation SRMS=Standardized-Root-Mean-Square-Residual