Download
1 / 17
170 likes | 249 Vues
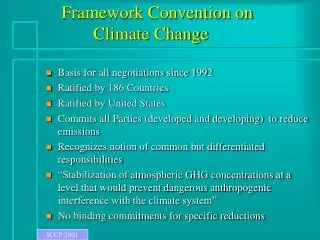
Framework for approaching climate change and health. US Climate and Health Alliance Webinar, May 14, 2014. Jonathan Patz, Professor & Director. Temperature data. Global Temperature Anomaly 1850-2012.

E N D
Framework for approaching climate change and health US Climate and Health Alliance Webinar, May 14, 2014 Jonathan Patz, Professor & Director
Temperature data Global Temperature Anomaly 1850-2012 “The globally averaged combined land and ocean surface temperature data .. show a warming of 0.85 [0.65 to 1.06]°C, over the period 1880–2012”IPCC AR5 WG1 2013 IPCC AR5 WG1 Figure SPM.1
Warming clearly not related to 11-year solar “sun spot” cycle (in red)
Just one reason why ~97% of climate scientists (out of >4,000 surveyed) agree that today’s heating of the earth is human-caused, primarily from burning fossil fuels, and by deforestation. Doran & Zimmerman, 2009; Anderegg et al. 2010, PNAS. Warming clearly not related to 11-year solar “sun spot” cycle (in red)
Global Climate Change Regional Changes: Land areas warm more than ocean areas, so Africa warms more than the global average IPCC, AR5, 2014
3rd National Assessment on Climate Change: released May 6, 2014
Projected heating of the US US National Climate Assessment, 2014
HEALTH EFFECTS FROM DISRUPTING CLIMATE Heat Stress Cardiorespiratory failure Respiratory diseases, e.g., COPD & Asthma Malaria Dengue Encephalitis Hantavirus Rift Valley Fever Cholera Cyclospora Cryptosporidiosis Campylobacter Leptospirosis Malnutrition Diarrhea Toxic Red Tides Forced Migration Overcrowding Infectious diseases Human Conflicts Urban Heat Island Effect Air Pollution & Aeroallergens Vector-borne Diseases Water-borne Diseases Water resources & food supply Mental Health & Environmental Refugees CLIMATE CHANGE Temperature Rise 1 Sea level Rise 2 Hydrologic Extremes 13°C by yr. 2100 240 cm““ IPCC estimates Patz, 1998
Patz, EHP 2000 Hess, NIEHS McMIchael 1997 Patz, 1998 Haines & Patz 2004 WHO LRudolph April 2014
Climate Variability and Change Extreme weather/storms
Emanuel, 2005 Hurricane Strength & Sea Surface Temps.
Climate Variability and Change temperature
Russia 2010: 1 month heatwave (>100°) 55,000 excess deaths 1 million acres burnt 25% drop in crop yields US$15 billion loss 'Mega-heatwaves' such as the 2003 and 2010 events broke the 500-yr long seasonal temperature records over 50% of Europe. Probability of 'mega-heatwaves’ will increase by a factor of 5 to 10 within the next 40 years. Barriopedro et al Science 21 March 2011 10.1126/science.1201224 Courtesy: Alistair Woodward
Future Extreme Heat - Wisconsin Courtesy: Dan Vimont, PhD