Download
1 / 13
130 likes | 275 Vues
DYNAMICS. WP3: STATED PREFERENCE PROGRESS REPORT. Accent Marketing and Research and Hague Consulting Group (1994) Bovy and Bradley (1985) Bradley, Marks and Wardman (1986) Transportation Planning Associates (1990) Hague Consulting Group and Accent Marketing and Research (1999).

E N D
DYNAMICS WP3: STATED PREFERENCE PROGRESS REPORT
Accent Marketing and Research and Hague Consulting Group (1994) Bovy and Bradley (1985) Bradley, Marks and Wardman (1986) Transportation Planning Associates (1990) Hague Consulting Group and Accent Marketing and Research (1999) SP STUDIES OF ROUTE CHOICE
Hague Consulting Group and Accent Marketing and Research (1999) Johnston, Bates and Roberts (1989) Preston and Wardman (1991) SP STUDIES OF DEPARTURE TIME CHOICE
Context Presentation Alternatives Attributes Response Analysis ASSESSMENT
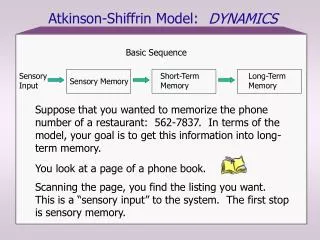
Context: two surveys, one for drivers of light vehicles (split into vehicles using whole of route and vehicles using part of route), and the other for commercial vehicle operators. For light vehicles that could use whole of route: Presentation: self-completion survey, provided with map, initial approach at service station or interception on road. Alternatives: four. Attributes: time spent in congested conditions, time spent in uncongested conditions, petrol costs and toll costs (if applicable). Response: ranking. Analysis: exploded logit. e.g. TPA (1990)
Car drivers and passengers survey Context: three core questionnaires (motorway users, trunk road users, urban road users). Presentation: self-completion questionnaires given to car drivers and passengers at filling stations at different locations throughout the country. Alternatives: two. Attributes: departure time, travel time. Response: choice. Analysis: logit. e.g. HCG AND ACCENT (1999)
Travel time in congestion Travel time not in congestion Trip length Petrol cost Toll cost Quality improvements Parking cost VARIABLES IDENTIFIED AS RELEVANT TO ROUTE CHOICE
Travel time Travel time variability Parking cost VARIABLES IDENTIFIED AS RELEVANT TO DEPARTURE TIME CHOICE
Presentation: combined route choice and departure time choice experiment, administered by self-completion questionnaire. Alternatives: four. Attributes: departure time, travel time, travel time variability, route, cost. Response: ranking. Analysis: exploded logit. PROPOSALS FOR SP DESIGN
Traffic congestion on your usual route means that there is an increase in travel time and/or travel time variability. Do you: Continue to make the usual journey at the usual time? Change departure time but use the usual route? Change route but depart at the usual time? Switch to public transport or not travel at all? BASIC QUESTION
Parking cost and availability how does this enter? Travel time variability presentation non-linearities interaction effects Travel time time in free flow vs. time in congested conditions (Non) variability of route and/or departure time choices ISSUES