Download
1 / 38
380 likes | 523 Vues
The Estonian Economy and Foreign Direct Investments. Tallinn 19 April, 2007 Stefan Andersson Enterprise Estonia. Estonia at a G lance. P opulation A rea L anguage C urrency GDP per Capita GDP G rowth E xport. 1. 34 million 45,000 km 2 Estonian EUR 1 = EEK 15.6 466 9 800 EUR

E N D
The Estonian Economy and Foreign Direct Investments Tallinn 19 April, 2007 Stefan Andersson Enterprise Estonia
Estonia at a Glance Population Area Language Currency GDP per Capita GDPGrowth Export 1.34 million 45,000 km2 Estonian EUR 1 = EEK 15.6466 9 800EUR 11.4 % (2006) 58 % of GDP (2006)
Population in the Baltic Sea Region Denmark 5.4 million Sweden 9.1 Finland 5.3 Norway 4.7 Germany* 6.3 Poland**38.1 Estonia 1.3 Latvia 2.3 Lithuania 3.4 Russia*** 7.2 TOTAL 80-85 million *Schlesw.-Hol, Meckl-VP, Hamburg ** Entire Poland ***St Petersburg, Kaliningrad, Len. oblast
Flight Connections • flights/weekflight hours • Helsinki49 0.5 • Stockholm 32 1.0 • Vilnius 21 1.5 • Copenhagen 19 1.5 • Oslo 18 1.5 • Riga 16 1.0 • Prague 14 2.0 • Amsterdam 14 2.5 • London 13 3.0 • Frankfurt 12 2.5 • Berlin 9 2.0 • Warsaw 71.5 • Brussels 7 2.5 • Göteborg 6 1.5 • Palanga 5 1.0 • Hamburg 4 2.0 • Paris 4 3.0 • Vienna 4 1.5 • Moscow 3 1.5 • Barcelona 3 4.0 • Milan 3 3.0 • Kiev 32.0 • Dublin 2 3.5 • Dubrovnik 2 3.0 • Simferopol 2 3.0 Source: Tallinn Airport, Summer2007 timetable
Stable Business Environment • EU and NATO Membership. • Low Tax Level. • Flexible Labour Market. • EURO-pegged Currency. • Balanced State Budget. • EqualTreatment of all Investors.Low State Intervention.
GDPGrowth Q4 2006 Source: EUROSTAT
GDPGrowth and Inflation1996-2006 Source: Statistical Office of Estonia
Natural Resources • Timber: • 2 mln ha, 48% of Estonia covered by forest • Wood-processing industryclosely connected to the Scandinavian forestry companies • Energy • Oil shale reserves 1,8 bln tons. Annual production 14 mln tons. 80% for electricity production.
Average Gross Salary in Estonia, (EUR/Month) Source: Statistical Office of Estonia
Knowledge Intensive Jobs(% of all jobs) Source: European Commission
Taxes in Estonia unemployment insurance 0.3 (employer) 0.6 (employee) * no corporate income tax on reinvested earnings Source: Enterprise Estonia
Corporate Income Tax Rates in Eastern Europe, 2007 Source: Enterprise Estonia (www.worldwide-tax.com)
Corporate Income Tax Rates in Europe 2007 * no tax on reinvested profits Source: Enterprise Estonia; WIR 2005
IT development in Estonia • e-elections (local 2005, national 2007) • e-government project (august 2000) • e-tax board- income tax statements can be filled out via internet (spring 2001) • digital signature act came into force (december 2000) • 90% electronic transactions, 80% of the population using internet banking (end 2005) • e-billing (july 2000) • world´s first MPS project for society (may 3, 2000) • mobile parking (july 1, 2000)
1. Denmark 2. Sweden 3. Singapore 4. Finland 5. Switzerland 6. Netherlands 7. USA 8. Iceland 9. United Kingdom 10.Norway 16. Germany 20. Estonia 23. France 28. Portugal 30. Slovenia 32. Spain 39. Lithuania 42. Latvia Networked Readiness Index 2006 - 2007 Source: World Economic Forum
internet users per 100 inhabitants 2005 Source: International Telecommunication Union
mobile phone subscribers per 100 inhabitants 2005 Source: International Telecommunication Union
1. Hong Kong 2. Singapore 3. Australia 4. United States 5. New Zealand 6. United Kingdom 7. Ireland 8. Luxembourg 9. Switzerland 10. Canada 11. Chile 12. Estonia 13. Denmark 16. Finland 21. Sweden 22. Lithuania 30. Norway 31. Czech republic 41. Latvia 45. France 60. Italy Index of Economic FreedomRankings 2007 Source: Wall Street Journal; The HeritageFoundation
1. Singapore 2. New Zealand 3. USA 6. UK 7. Denmark 10. Ireland 11. Japan 13. Sweden 14. Finland 16. Lithuania 17. ESTONIA 21. Germany 24. Latvia 35. France 36. Slovakia 52. Czech Republic 61. Slovenia 66. Hungary 75. Poland 96. Russia Ease of Doing Business Ranking 2006 Source: World Bank Group
1. Switzerland 2. Finland 3. Sweden 4. Denmark 5. Singapore 6. USA 7. Japan 8. Germany 9. Netherlands 10. UnitedKingdom 12. Norway 18. France 25. Estonia 28. Spain 29. Czech republic 36. Latvia 40. Lithuania 41. Hungary 48. Poland Growth Competitiveness Rankings 2006-2007 Source: World Economic Forum
1. Finland 1. Iceland 1. New Zealand 4. Denmark 5. Singapore 6. Sweden 7. Switzerland 8. Norway 16. German 18. France 20. USA 24. ESTONIA 28. Slovenia 41. Hungary 45. Italy 46. Czech Republic 46. Lithuania 49. Latvia 61. Poland 163. Haiti Corruption Perception Index 2006 Source: Transparency International
1. Denmark 2 - 3. Finland 2 - 3. Iceland 4. USA 5. UK 6. Singapore 7 - 8. Australia 7 - 8. ESTONIA 9. Ireland 14. Norway 16. Germany 18. Sweden 21. Japan 22. Latvia 29. Lithuania 31. Slovenia 32. Slovakia 33. Czech Republic 35. Poland 37. Hungary Capital Hospitality Index 2006 Source: Forbes
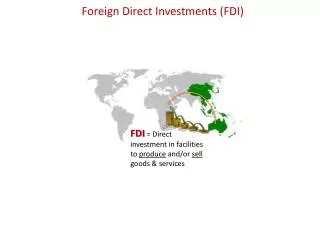
Foreign Direct Investments (FDI) • Equal Rights with Local Businesses • Right to Purchase and Own Land* • Unrestricted Profit Repatriation * Approval needed when acquiring more than 10 ha of land
FDI into Estonia 1997–2006 Source: Bank of Estonia
FDIStock in Estonia, by country, as of 31 December 2006 total stock 12.39 billion EUR Source: Bank of Estonia
FDI Stock in Estonia, by Activity,as of 31 December 2006 total stock 12.39 billion EUR Source: Bank of Estonia
regional distribution of fdi, end 2005 Source: Bank of Estonia
fdi per capita, (stock, USD) Source: UNCTAD
Estonian Exports and Imports 1997 –2006 Source: Statistical Office of Estonia,special trade method
Estonian Exports by Country, 2006 January-June total: 7.6 bln EUR Source: Statistical Office of Estonia,special trade method
Estonian Exports by Commodity Groups, 2006 total: 7.6 bln EUR Source: Statistical Office of Estonia,special trade method
Estonian Imports by Country, 2006 total: 10.3 mio EUR Source: Statistical Office of Estonia,special trade method
Estonian Imports by Commodity Groups, 2006 total: 10.3 mio EUR Source: Statistical Office of Estonia,special trade method
IndustrialStructure Source: Statistical Office of Estonia
Major Foreign Investors HK-Ruokatalo Atria Larvik Cell/Heinzel Maersk Borås Wäfveri Tolaram Grupp Severstaltrans Citycon Swedbank SEB TeliaSonera Tele2 Elisa Stora Enso Hallberg-Sekrom Autoliv
general and industry specific information about Estonia and its investment and business (subcontracting and trade) opportunities • useful contacts with the public and private sector (utilities, law firms, consultants, recruitment, industrial real estate, …) • legal matters (how to establish a company, visa and residencepermit questions, etc) • arrangementof company visits • assistance in finding industrial property