Download
1 / 16
160 likes | 255 Vues
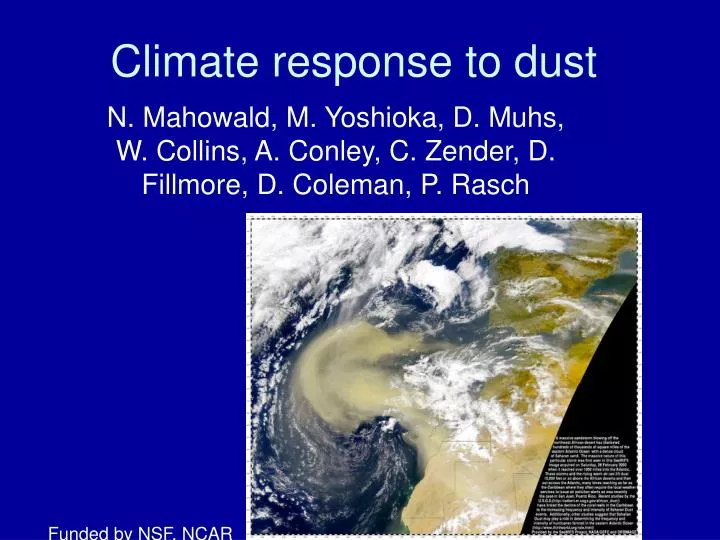
Climate response to dust. N. Mahowald, M. Yoshioka, D. Muhs, W. Collins, A. Conley, C. Zender, D. Fillmore, D. Coleman, P. Rasch. Funded by NSF, NCAR. Desert dust/mineral aerosols . Soil particles suspended in area Source: Unvegetated, dry soils with strong winds Removal

E N D
Climate response to dust N. Mahowald, M. Yoshioka, D. Muhs, W. Collins, A. Conley, C. Zender, D. Fillmore, D. Coleman, P. Rasch Funded by NSF, NCAR
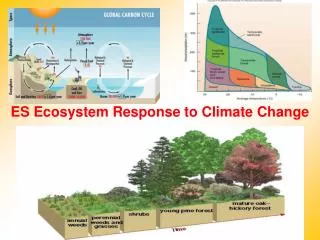
Desert dust/mineral aerosols • Soil particles suspended in area • Source: • Unvegetated, dry soils with strong winds • Removal • Dry deposition, especially gravitation settling • Wet deposition, during precipitation • Model the sources, transport and deposition processes in 3-dimensional model (offline transport model: MATCH/NCEP or NCAR Community Atmospheric Model (CAM3) from the Community Climate System Model (CCSM3)) • Papers available at www.cgd.ucar.edu/tss/staff/mahowald
U. Miami data, Mbouru et al., visibility data We know that dust responds to climate on regional to global on short to long time scales by a factor of 4 to 100. Dust is often used a proxy for climate change in the paleo record. How does this change in dust impact climate?
Sensitivity study (Yoshioka et al., in press) • Using CAM3 and slab ocean model • AMIP runs (SST impacts) • Vegetation changes (force model to change similar to estimated changes 1960s to 1990s) • Green house gas changes (2x co2 SOM runs) • Dust changes (with and without dust direct radiative forcing) • Only include direct radiative effects (ignoring CCN or IN interactions, which may be important) • Can’t get dust signal with amip and vegetation changes—need to force model to capture dust change at barbados • Model error • Land use source of dust • Vegetation change source of dust
CAM3/SOM Dust radiative feedback impacts on precip Not including long wave in CCSM3 enhances double “ITCZ” (not shown) Impacts of dust onto climate/precipitation • Impacts on Sahel precip. • SSTs ~50% of observed precip change • Vegetation changes Not significant • GHG has wrong signal (increases precip in Sahel) • Model can’t capture dust changes observed, but observed dust changes (when forced onto model) cause ~30% change in observed precip in Sahel • Dust could be important feedback on Sahel precip Yoshioka et al., in press
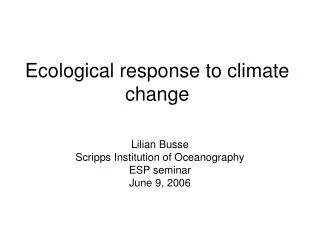
Climate response to dust under different climates Mahowald et al., 2006
How robust is this response? • Physical parameterizations or physical biases will impact our simulation of dust (or x variable we are interested in). • How does this impact our precipitation sensitivity? • Shift in precip due to dust radiative forcing is not sensitive to climate in our model (Mahowald et al., 2006) • Response is sensitive to single scattering Albedo (Miller et al., 2004; other papers) • Radiative properties of dust are not well established • Dust absorbs and scatters in long AND short wave • NOT spherical particles!
Miller et al., 2004 Precip is sensitive to single scattering albedo If single scattering albedo is larger than their base case (as in our case), see consistent shifts, maybe. New version of GISS model has higher single scattering albedo than used in Miller et al., 2004. , due to updates in optical properties.
How sensitive is the response of ‘desert regions’ to climate model used? • Use PCMDI models (17) • Use anomalies from current climate to force BIOME4 vegetation model (Kaplan et al., 2003). (Asynchronous coupling, desert vegetation reaches equilibrium quickly) • Calculate estimated desert area for future climate • (use co2 fertilization and no fertilization). • Lots of spread! • CCSM is somewhat extreme in wetting Sahel in future • (Regional model have different response?) • Want to do this interactively in model (Andrea Sealy in working on dust/AOVM modeling now within CCSM) Latitude Latitude Latitude Latitude Latitude Latitude Mahowald et all, in prep averages over -40 to 20E vs. latitude
Smaller scale interactions • Dust and easterly waves • 20-40% of dust is generated and transported associated with easterly waves (Jones et al., 2003; using NCEP and NCEP/MATCH) • Easterly waves maybe enhanced by dust (Jones et al., 2004 NCEP/MATCH; Jones et al in prep (CAM3 T85) • Dust and hurricanes • Dust cools surface and suppresses precip in our model, some observation studies….(Yoshioka et al., in press, Wong and Dessler, Evans et al., in prep)…
Summary/conclusions In this set of model simulations: • SSTs are responsible for 50% of the Sahel signal (pretty robust across models) • Vegetation NS (different models show different results) • Dust responsible for up to 30% of Sahel drought signal in this model (consistent with one existing study? Need more models!) • Dust could be ‘natural’ or anthropogenic (Mahowald et al., 2002; Prospero and Lamb, 2003; Mahowalld and Luo, 2003; Tegen et al., 2004; Mahowald et al., 2004) • GHG in this model lead to higher precip—not robust result • Dust potentially an important feedback factor that should be better explored. • Not discussed here at length, but should not be ignored: • Anthropogenic changes in ‘natural’ aerosol are potentially large and should not be ignored • from direct perturbation of land (land use), climate change or carbon dioxide fertilization of plants • our estimates: (Mahowald et al., 2006; Mahowald and Luo, 2003) • PreindustrialI to present (-0.1 to 0.30C) • Present to future (doubled CO2) is about ~+0.06C • Dust changes could also be driving changes in ocean biogeochemistry and carbon dioxide fluxes (Mahowald et al., 2006; Moore et al., 2006)
Dust response to climate • Assume only ‘natural’ sources of dust (can’t eliminate 0-50% potential contribution from land or water use (Mahowald et al., 2002: 2004; Mahowald and Dufresne, 2003; Mahowald and Luo, 2003), but ignore for now). • Assume climate (precip, Ts, cloudiness) and carbon dioxide fertilization of plants important. (Smith et al., 2000; Moore et al., in press suggests carbon dioxide fertilization reasonable with 2x co2). • Vegetation response most important in this model (similar to Mahowald et al., 1999; dissimilar to Werner et al.,2002). No dynamic veg (asynchronous coupling with BIOME3). Mahowald et al., 2006
Compare model changes to obs • Can’t distinguish preindustrial from current (Mahowald and Luo, 2003; Mahowald et al. 2006. • Compare against all available data in current climate. Dust deposition records for last glacial maximum. • For LGM: Use geological record to infer ‘glaciogenic’ sources and best match terrestrial sediment record Current: SOMB SOMBLGMC SOMBLGMT Mahowald et al., 2006
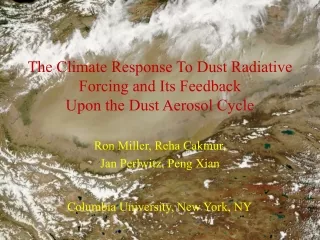
Linearity in response in RF (surface or top of atmosphere) or global surface temperature or global precipitation in this model Squares TOA, triangles SFC True in other models? Compare to sensitivity experiments in the single scattering albedy done in GISS model (values courtesy of R. Miller: Miller and Tegen, 1998; Miller et al., 2004)