Download
1 / 1
10 likes | 101 Vues
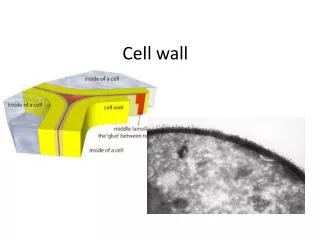
Table 1. Summary table of genotype means and variation. “95% range” is the range within which 95% of genotypes lie, assuming a normal distribution (2*1.96*SD). . Variation in cell wall digestibility of perennial ryegrass at heading stage Frederik van Parijs.

E N D
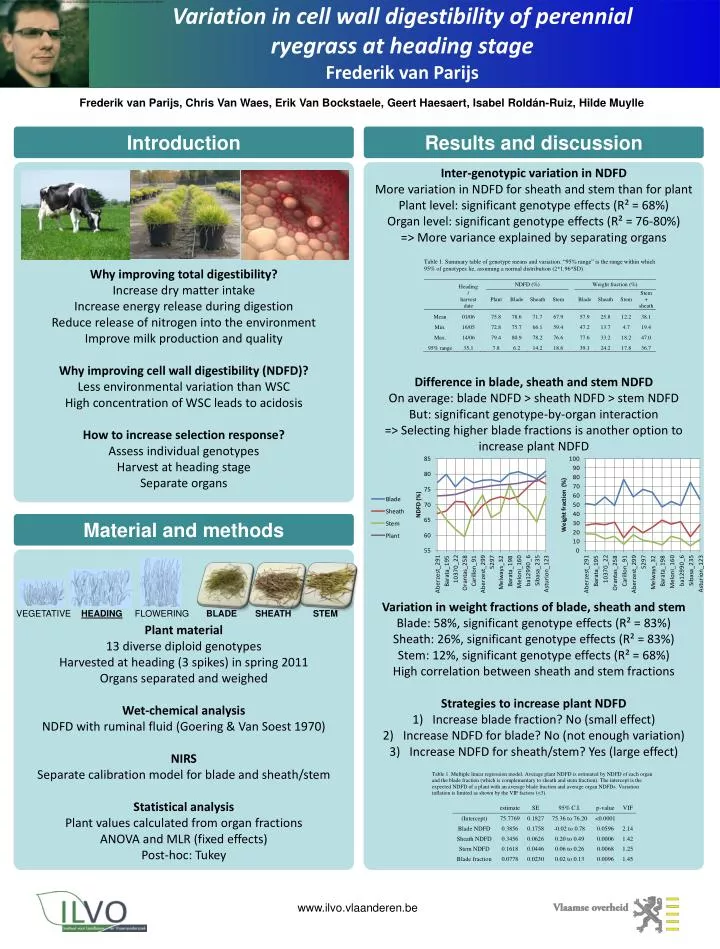
Table 1. Summary table of genotype means and variation. “95% range” is the range within which 95% of genotypes lie, assuming a normal distribution (2*1.96*SD). Variation in cell wall digestibility of perennial ryegrass at heading stageFrederik van Parijs Frederik van Parijs, Chris Van Waes, Erik Van Bockstaele, Geert Haesaert, Isabel Roldán-Ruiz, Hilde Muylle Introduction Results and discussion • Inter-genotypicvariation in NDFD • More variation in NDFD forsheath and stem thanfor plant • Plant level: significant genotype effects (R² = 68%) • Organ level: significant genotype effects (R² = 76-80%) • => More varianceexplainedbyseparatingorgans • Difference in blade, sheath and stem NDFD • On average: blade NDFD > sheath NDFD > stem NDFD • But: significant genotype-by-organ interaction • => Selecting higher blade fractions is another option to increase plant NDFD • Variation in weight fractions of blade, sheath and stem • Blade: 58%, significant genotype effects (R² = 83%) • Sheath: 26%, significant genotype effects (R² = 83%) • Stem: 12%, significant genotype effects (R² = 68%) • High correlationbetweensheath and stem fractions • Strategies to increase plant NDFD • Increasebladefraction? No (small effect) • Increase NDFD forblade? No (notenoughvariation) • Increase NDFD forsheath/stem? Yes (large effect) • Whyimprovingtotaldigestibility? • Increase dry matter intake • Increaseenergy release duringdigestion • Reduce release of nitrogeninto the environment • Improvemilkproduction and quality • Whyimprovingcellwalldigestibility (NDFD)? • Lessenvironmentalvariationthan WSC • High concentration of WSC leads to acidosis • How to increaseselection response? • Assessindividualgenotypes • Harvest at heading stage • Separate organs Material and methods VEGETATIVE HEADING FLOWERING BLADE SHEATH STEM Plant material 13 diverse diploidgenotypes Harvested at heading (3 spikes) in spring 2011 Organsseparated and weighed Wet-chemicalanalysis NDFD withruminalfluid (Goering & Van Soest 1970) NIRS Separate calibration model forblade and sheath/stem Statisticalanalysis Plant valuescalculatedfromorganfractions ANOVA and MLR (fixedeffects) Post-hoc: Tukey