Download
1 / 17
170 likes | 174 Vues
Part VII – Exploring and Understanding Data. Ch 26 – Comparing Counts Day 1 - The Chi-Square Distribution. The Chi-Square Test. The Chi-square test has two uses: Goodness of fit: to determine if data fits a given distribution

E N D
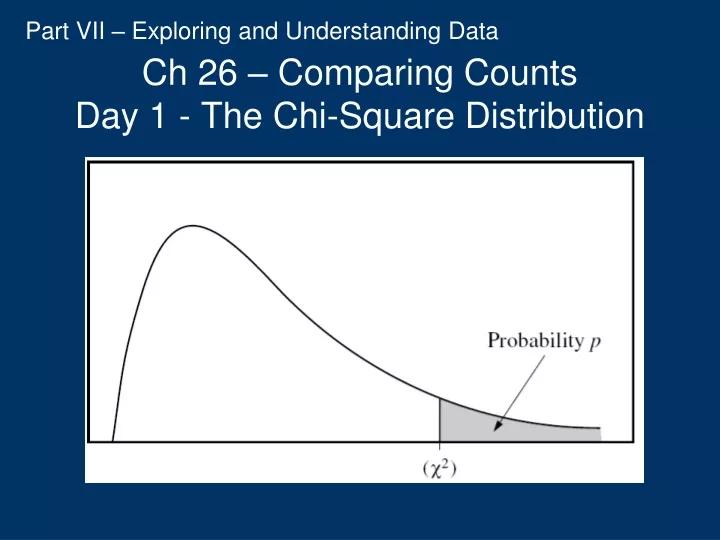
Part VII – Exploring and Understanding Data Ch 26 – Comparing CountsDay 1 - The Chi-Square Distribution
The Chi-Square Test • The Chi-square test has two uses: • Goodness of fit: to determine if data fits a given distribution • Independence: to determine if there is a relationship between two categorical variables
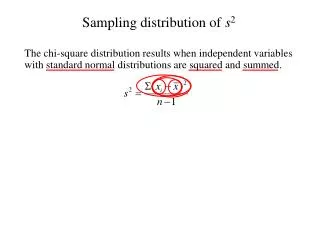
The Chi-square test statistic • The basic idea behind chi-square is to see if what really happened is significantly different from what you expected to happen • The formula for a chi-square test statistic is:
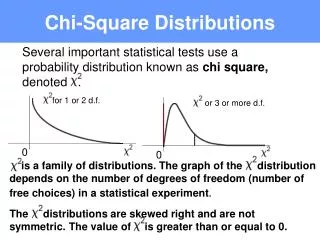
Decisions using Chi-square • We use chi-square only for hypothesis tests – no confidence intervals • Once we get a test statistic, we use the chi-square table to make a decision as to whether or not to reject H0 • The table works in a similar way to the t-table
Goodness of Fit Test • A botanist wants to know if a certain insect has a preference in the color of roses it eats. She records the number of insects who infest each color in her study.
Hypotheses • For this type of test there are no symbols in the hypotheses, only words • The null hypothesis basically states that there is nothing unusual going on • In this case: H0: the insects have no color preference Ha: the insects do have a color preference
Type of Test • Chi-square test for goodness of fit • α = .05 • df = 3 • For goodness of fit tests: df = # of categories – 1
Make sure you show your expected counts somewhere in your problem Conditions for Chi-square
Expected Values • The expected values are based on your null hypothesis • In this problem, if our null hypothesis was true, all cells would have the same value
Conclusion • Since p < .05, reject H0. There is enough evidence to conclude that the insects do have a color preference.
Another example… • An anatomy teacher hypothesizes that the final grades in her classes are distributed as 10% A’s, 23% B’s, 45% C’s, 14% D’s and 8% F’s. At the end of the semester, a random sample of her students has the following grades. Was her hypothesis correct?
Expected Values • 10% A’s, 23% B’s, 45% C’s, 14% D’s and 8% F’s • Total in sample = 53 5.3 12.19 23.85 7.42 4.24
H0: The distribution does fit the teacher’s hypothesisHa: The distribution doesn’t fit the teacher’s hypothesis Χ2 test for goodness of fit, α=.05, df =4 Stated Since p >.05, fail to reject H0. There is not enough evidence to conclude that the teacher’s grades do not fit her hypothesis. No – one count is < 5 this concerns us, but we will proceed
Homework 26-1 • GOF WS