Download
1 / 14
140 likes | 274 Vues
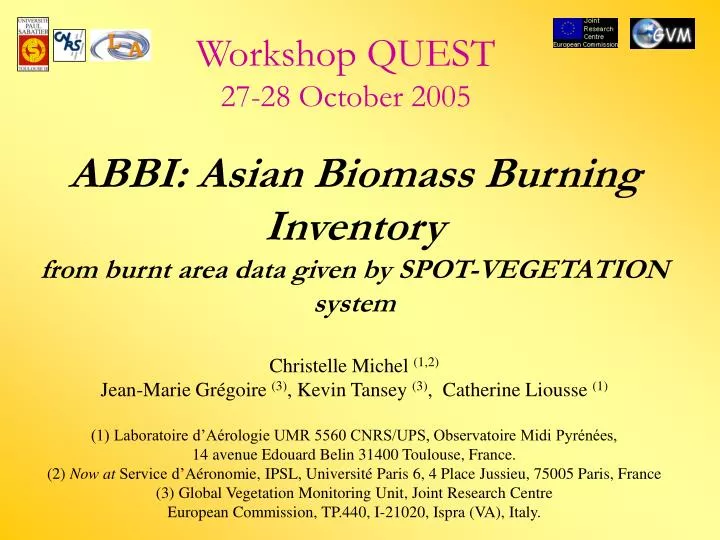
Workshop QUEST 27-28 October 2005. ABBI: Asian Biomass Burning Inventory from burnt area data given by SPOT-VEGETATION system. Christelle Michel (1,2) Jean-Marie Grégoire (3) , Kevin Tansey (3) , Catherine Liousse (1)

E N D
Workshop QUEST 27-28 October 2005 ABBI: Asian Biomass Burning Inventoryfrom burnt area data given by SPOT-VEGETATION system Christelle Michel(1,2) Jean-Marie Grégoire (3), Kevin Tansey (3), Catherine Liousse (1) (1) Laboratoire d’Aérologie UMR 5560 CNRS/UPS, Observatoire Midi Pyrénées, 14 avenue Edouard Belin 31400 Toulouse, France. (2) Now at Service d’Aéronomie, IPSL, Université Paris 6, 4 Place Jussieu, 75005 Paris, France (3) Global Vegetation Monitoring Unit, Joint Research Centre European Commission, TP.440, I-21020, Ispra (VA), Italy.
Context and Objectives • Objectives: To perform an inventory of gases and aerosols emitted by vegetation fires in Asia during the ACE-ASIA experiment: March 1st - May, 15th 2001 • Rationale for a satellite based approach: • Quantitative and repetitive observations in space and time • Availability of long time series: past and future • Frequency of observations • Spatial and temporal consistency of data
active fires smoke burnt areas Helicopter view SPOT-VEGETATION imagery • Mapping burnt area instead of detection of fire events • To minimize the effect of temporal sampling(long lasting « signature » /instantaneous « signature ») • A step towards a quantitative assessment of the burnt biomass (structural information, i.e. geographical area of burnt scar)
0 50 20 – 29 April 2001 : nb. fire events (derived from AVHRR) 04/26/01 : SPOT-Vegetation 04/22/01: Landsat TM Zoom on India: comparison of the 2 acquisition methods zoom The expected high fire activity on the East coast of India is not confirmed by the burnt areas (even on the high resolution TM images) • Strong uncertainty related to the active fire maps (derived from NOAA-AVHRR)
03/06/2001 : Landsat TM 03/26/001 : SPOT-VGT Consistency of the burnt area method • The burn scars detected on the TM images are also visible on the SPOT-VEGETATION data despite the different spatial resolution
Extraction Module spatio-temporal subset from the global archive: 1 Gb/day out of 6.6 Gb/day Pre-processing Module (masking of clouds, shadows, snow, SWIR saturation, extreme view angle, non-vegetated surf., temporal compositing) Processing Module Forest-non forest masking Algorithm: Ershov et al., 2001 • Test of several processing algorithms • Selection of Ershov et al., 2001 Data processing & Analysis • Input data: • Images SPOT-VEGETATION imagery (S1: daily,1 km, “ground reflectance”) • Global Land Cover product of University of Maryland (Hansen et al., 2000) • Processing: GBA-2000 processor (Tansey et al., 2002) • Output: location (lat-long) of pixels classified as burnt and date of burning • A series of problems have been encountered • Dense cloud cover • Small and scattered fires (fire practices) • Start of the monsoon season at the end of the ACE-Asia period • Wide range of vegetation cover types & climatic conditions (desert to evergreen moist forest)
Burnt pixels map GIS burnt area* / country / vegetation Vegetation Map burnt area / country / latitudinal strip AdministrativeMap burnt area / vegetation / 1°x1° grid Latitudinal Strip 1x1° Grid burnt area / … / … GIS (Geographic Information System) analysis * Assumption: 1 pixel burnt = 1 km2
Building the emissions inventory ABBI • The emission flux for the species X (Q) may be calculated as following [Seiler and Crutzen, 1980] : Q = M x EF(X) • EF(X): the emission factor, defined as the ratio of the mass of the emitted species to the mass of dry vegetation consumed (g/kg dry plant). • M: the burnt biomass: M = A x B x a x b • where: • A the burnt area available (SPOT-VGT) • B the biomass density from literature • a the fraction of aboveground biomass “ • bthe burning efficiency “
Adaptation of the various factors to the vegetation classes • The estimates of the biomass density and the burning efficiency are based on recent improvements in vegetation parameterization [from a review conducted by Palacio et al., 2002] • For carbonaceous aerosols : emission factors have been specially selected for the vegetation classes present in Asia [from Liousse et al., 2004] [Michel et al., 2005] • For gases : emission factors given by Andreae and Merlet [2001]
Results of the spatial and temporal distribution of the emissions (March – May 2001) • Daily distribution for 58 gases and BC and OC particulate species (1 March – 15 May 2001) : ABBI inventory [Michel et al., 2005] BC emissions (1-10 may 2001)
ABBI Comparison between 2000-2001 ABBI : Black Carbon emissions • Differences in spatial and temporal distribution • Strong inter-annual variability
Comparison ABBI [Michel et al., 2005] – ACESS [Streets et al., 2003]: BC temporal distribution • BC (ABBI) = 2.5E+5 tonnes (of which 1.39E+5 tonnes for FSU countries and Kazakhstan) • BC (ACESS) = 1.83E+5 tonnes !! ACESS doesn’t take into account FSU countries and Kazakhstan
Avril 11-20: ACESS Avril 11-20: ABBI Mai 1-10: ACESS Mars 21-31: ABBI Mai 1-10: ABBI Mars 1-10: ABBI Mars 1-10: ACESS Mars 11-20: ABBI Mars 11-20: ACESS Mars 21-31: ACESS Avril 21-30: ABBI Avril 21-30: ACESS Avril 1-10: ABBI Avril 1-10: ACESS Comparison ABBI [Michel et al., 2005] – ACESS [Streets et al., 2003]: BC spatial distribution ABBI: Asian Biomass Burning Inventory ACESS: Ace-Asia and Trace-P Modelling and Emission Support System !! ACESS doesn’t take into account FSU countries and Kazakhstan
Conclusion • Comparison ABBI-ACESS and years 2000 – 2001 : multi-system approach • hot spot products in dense tropical forest • burnt area products in all the other types of vegetation cover • seasonal factors for vegetation parameterization (biomass density and burning efficiency) • accurate land cover maps