Download
1 / 19
190 likes | 304 Vues
Assessment of wave propagation in mice cornea and lens using phase stabilized swept source optical coherence tomography. Ravi K. Manapuram, Floredes M. Menodiado, Jiasong Li, Salavat R. Aglyamov , Maleeha Mashiatulla , Shang Wang, Stanislav Emelianov and Kirill V. Larin. SFM 2012

E N D
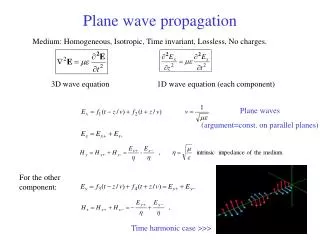
Assessment of wave propagation in mice cornea and lens using phase stabilized swept source optical coherence tomography Ravi K. Manapuram, Floredes M. Menodiado, Jiasong Li, Salavat R. Aglyamov, Maleeha Mashiatulla, Shang Wang, StanislavEmelianov and Kirill V. Larin SFM 2012 25th September 2012
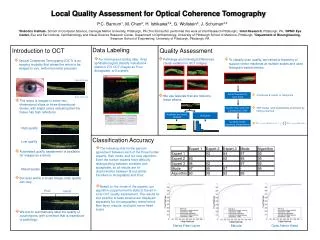
Why do we should study biomechanical properties of lens and cornea • Lens • Diagnosis • Presbyopia: Change of corneal curvature • Induces changes in • stiffness of the lens • strain distribution • Young’s Modulus • Cataract • Astigmatism • Glaucoma • Age related effects • Better understanding of lens nucleus and cortex • Study the accommodation process • Lens development • Cornea • Diagnosis • Keratoconus: Change of corneal curvature • Induces changes in • strain distribution • stiffness • shear modulus • Bending • Keratecstasia and progressive post LASIK (PPLK) • Outcomes of refractive surgeries such as micro incisions, corneal transplants, etc., • Accurate measurements of IOP. • Corneal Hysteresis
General methods induce a stimulus and measure the ocular tissue response DMA MRI B-mode Ultrasound Supersonic shear imaging Acoustic radiation force Electro optical systems (ORA) Optical methods including OCT Mechanical stimulus Ultrasound Laser pulse Air puff require tissue stimulation on the order of mm amplitude Dynamic Mechanical Analyzer (DMA) : in vivo ? The Ocular Response Analyzer (ORA) is a commercially available clinical instrument ORA require a large displacement of the corneal surface The predictability of this system is still under investigation
Outline • General methods to quantify stiffness • Induce a stimulus and measure the response (wave parameters) • Phase resolved method for quantifying wave parameters • 1. Ex vivo and In vitro results published earlier1,2,3 • 2D amplitude distribution in mice lens in vitro1,2 • 2D amplitude distribution in mice lens in vivo5 • Methods to quantify wave velocity 1Manapuram et al., Laser PhysLett.,8(2), 164-168 (2011). 2Manapuram et al., Proc. SPIE, 7885,78851V (2011). 3Manapuram et al., Proc. SPIE, 8209,82090S (2012). 4Manapuram et al., Laser Phys., accepted (2012). 5Manapuram et al., Invest. Ophth. Vis. Sci., in preparation (2012).
System and experiment setup Excitation unit and measurement unit Excitation unit Manapuram et al., Laser Phys (accepted) 2012 Manapuram et al., Laser Phys Lett.,8(2), 164-168 (2011). Manapuramet al., Proc. SPIE, 7885,78851V (2011).
Procedure (a) 3D image of the eye showing the excitation point and the points where phases are measured 2D image of the eye showing the capability of PhS-SSOCT for whole eye imaging Manapuramet al., Proc. SPIE, 8209,82090S (2012).
Procedure Optical pathlength modulation amplitude Amplitude Mapping can be achieved with surface distance. Manapuram et al., Proc. SPIE, 7885,78851V (2011).
Phase response from mice cornea in situ Phase response at the surface of the cornea (a) younger (1 month) mice (b) older (9 month) mice; points are the real data whereas the line plot is the smoothened data(Note that the shift in response has no significance due to the lack of knowledge of time of pulse.
2D amplitude map mouse cornea in situ 0.2 /mm 0.35 /mm 0.714 /mm 0.5 /mm 9 month old (43% per mm) 1 month old (attenuation: 93% per mm) This lateral spatial anisotropy is to be expected based upon the non uniform orientation and distribution of collagen fibrils that has been shown in mice. Manapuramet al., Proc. SPIE, 8209,82090S (2012). Manapuram et al.,JBOL (2012).
Damping of wave amplitude as a function of age (mice cornea in situ ) (a) Damping of normalized amplitude damping over the distance from the tapping point and (b) Mean attenuation versus mice age.
Delay in wave (mice cornea in situ ) The harmonic oscillations took 0.2 ms to travel from top surface to the bottom surface
Experiment setup for studies on mice eye (both cornea and lens) in vivo
2D Amplitude map (Lens in vivo) Bottom layer Top layer
2D Amplitude map (Cornea in vivo) Bottom layer Top layer
Conclusions • We have extended our previously demonstrated method of quantifying nanometer-level vibrations to measure mechanical wave propagation in the mouse lens and cornea in vivo. • The method utilizes phase response of the tissue surface to a pulsed excitation and the phase response is detected using M-mode imaging capabilities of PhS-SSOCT. • We have shown that mechanical wave propagation in the cornea of different aged mice vary significantly, which we attribute to differences in stiffness. • Therefore, PhS-SSOCT could be an effective tool for measurements of mechanical wave propagation in soft tissues.