Download
1 / 1
10 likes | 1.06k Vues
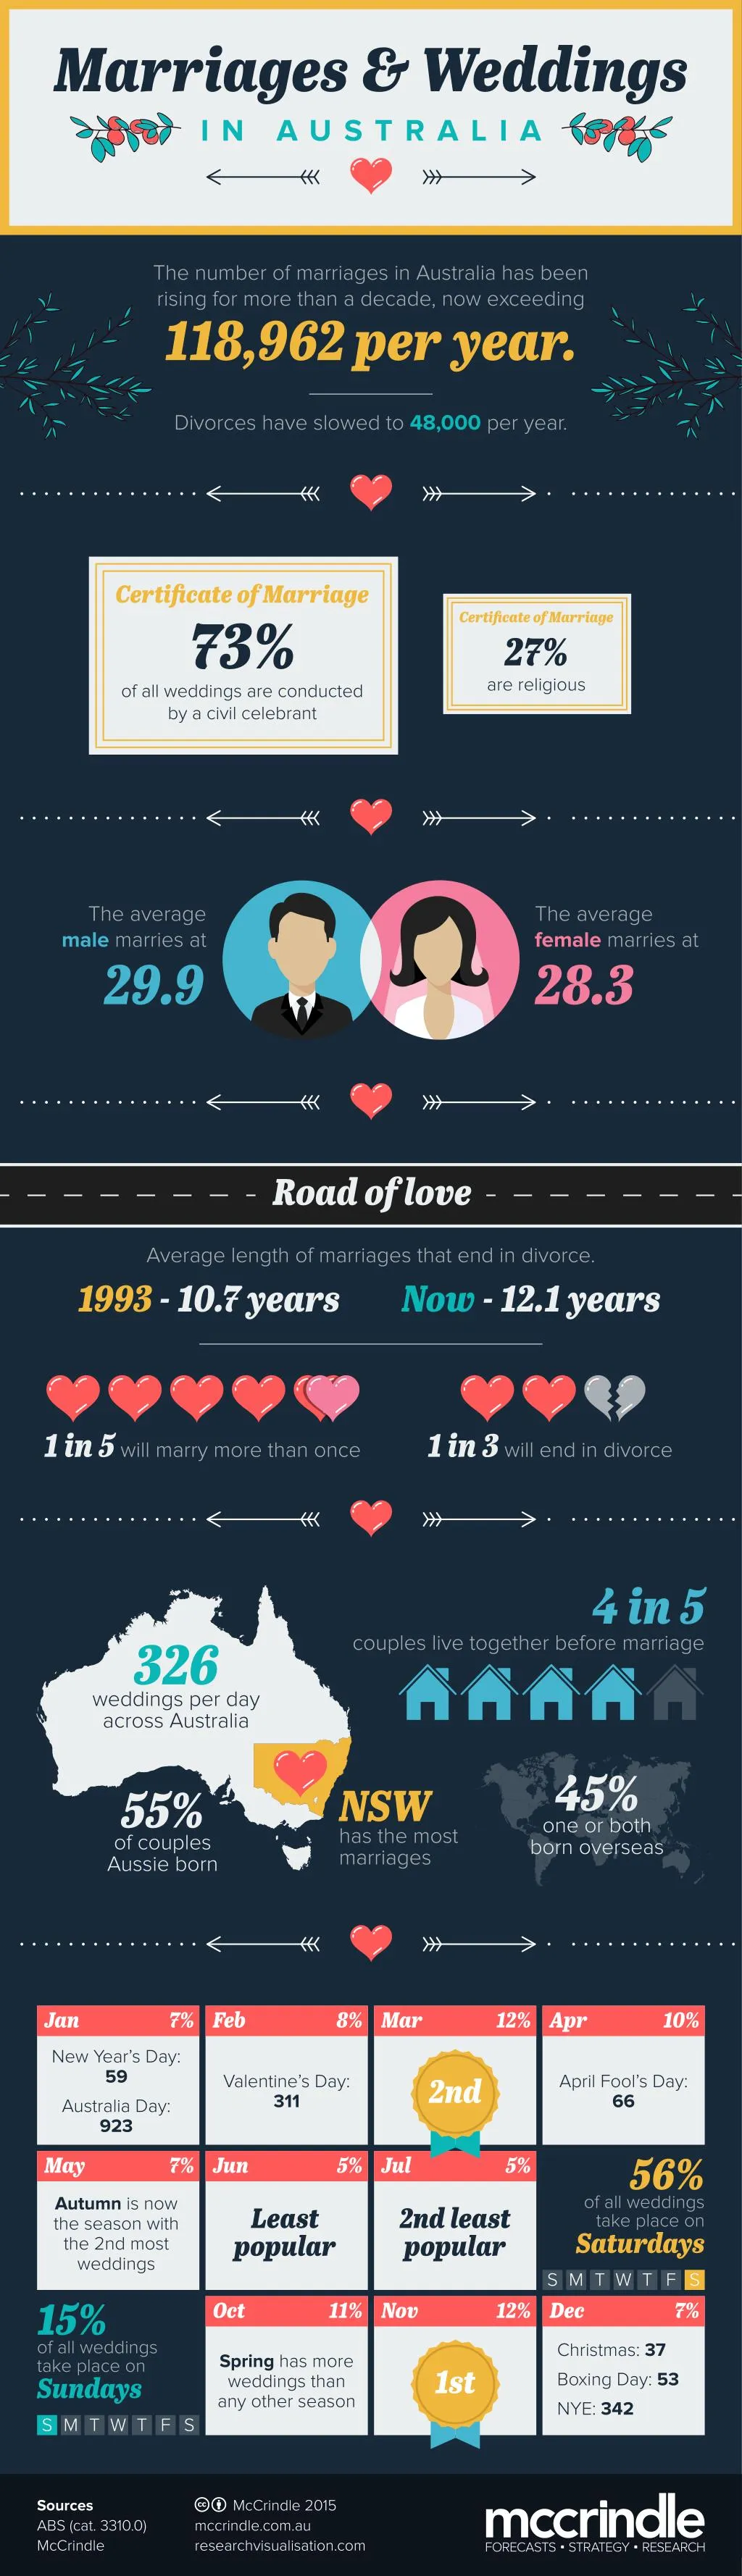
Analysis of the latest ABS marriages data (ABS cat 3310.0) shows that wedding numbers are on the decrease and that Aussies are choosing to get married younger. And with the ‘in-between’ seasons (Autumn and Spring) deemed the most popular times of year to tie the knot, wedding venues in Australia should brace for a few busy days over the coming months. <br><br>MARRIAGES ON THE DECLINE? <br>While the number of marriages taking place each year in Australia has been rising for more than a decade, recent figures show that marriages are on the decrease, with an average of 118, 962 marriages taking place per year, a figure that is down 4,282 since 2011. <br><br>This means that we see an average of 326 marriages occurring per day across Australia, with the most happening in New South Wales, followed closely by Queensland. <br><br>BRIDE AND GROOM GETTING OLDER <br>First time Brides & Grooms are getting older: The average age of first time brides is now over 28 and around 30 for first time grooms. There are now less than half as many grooms aged 20-24 as there were in 1993. And while brides we most commonly aged 20-24 in 1990 today they rank third after those aged 25-29 and 30-34. In 2013 there were 77 Australians that married for the first time who were aged over 75! <br><br>COHABITATION STILL DOMINANT, BUT DECREASING <br>Up until recently, the number of Australians living together prior to marriage had risen every year since records on this began more than a decade ago. In 2010 this figure peaked at 79%, but has since decreased slightly to 77%. While on the decline, this still means that currently, almost 4 in 5 Australian couples live together before marrying. <br><br>CULTURALLY DIVERSE MARRIAGES <br>55% of couples married are both born in Australia, while the remainder (45%) have one or both partners born overseas. <br><br>AUTUMN AND SPRING THE TIME TO WED <br>November (spring) and March (autumn) are the most popular months to get married, each hosting 12% of Australia’s yearly marriages. October is also quite popular, hosting 11% followed by April (10%). <br><br>The least likely month to wed in Australia is the dead of winter – June and July – each hosting 5% of Australia’s yearly marriages. <br><br>SATURDAY WEDDINGS MOST POPULAR <br>Saturdays are by far the most popular day to get married, on which 56% of all weddings take place. Sunday is also a popular day, with 15% of weddings taking place on a Sunday, a figure that is up from 13% in 2011. <br><br>Time and money challenges may be the factors influencing couples to get creative with their marriage date. Some interesting choices in 2013 included, 59 marriages on New Year’s Day. <br><br>Social Researcher Mark McCrindle said Australia is seeing a migration away from wedding in the hot Summer months ‘due to greater competition for venues, higher venue prices and the increased flexibility with taking leave from work outside these months, which influence couples as they choose a date.

E N D
Marriages & Weddings I N A U S T R A L I A The number of marriages in Australia has been rising for more than a decade, now exceeding 118,962 per year. Divorces have slowed to 48,000 per year. Certificate of Marriage 73% of all weddings are conducted by a civil celebrant Certificate of Marriage 27% are religious The average male marries at 29.9 The average female marries at 28.3 Road of love Average length of marriages that end in divorce. 1993 - 10.7 years Now - 12.1 years 1 in 5 will marry more than once 1 in 3 will end in divorce 4 in 5 326 weddings per day across Australia couples live together before marriage 45% one or both born overseas 55% of couples Aussie born NSW has the most marriages Jan 7% Feb 8% Mar 12% Apr 10% New Year’s Day: 59 Australia Day: 923 2nd Valentine’s Day: 311 April Fool’s Day: 66 56% take place on Saturdays S M T W T F S May 7% Jun 5% Jul 5% of all weddings Autumn is now the season with the 2nd most weddings Least popular 2nd least popular 15% of all weddings take place on Sundays S M T W T F S Oct 11% Nov 12% Dec 7% Christmas: 37 Boxing Day: 53 NYE: 342 Spring has more weddings than any other season 1st cbMcCrindle 2015 mccrindle.com.au researchvisualisation.com Sources ABS (cat. 3310.0) McCrindle