Download
1 / 51
510 likes | 515 Vues
2011-12 Annual Meeting and Budget Hearing. East Troy Community School District. Call to Order Pledge of Allegiance Election of a Temporary Chairperson Appoint Recording Clerk. VI. DISTRICT ADMINISTRATOR’S REPORT. A. District History, Trends, and Stats B. Student Achievement

E N D
2011-12 Annual Meeting and Budget Hearing East Troy Community School District
Call to Order Pledge of Allegiance Election of a Temporary Chairperson Appoint Recording Clerk
VI. DISTRICT ADMINISTRATOR’S REPORT A. District History, Trends, and StatsB. Student Achievement C. Additional Data Points
Mission Statement Ensuring and providing 21st century learning through: engaged student learning, quality teaching, strong leadership, rigorous coursework, and community service opportunities while demonstrating efficiency and effectiveness for the betterment of the students and community.
21ST C. ADVISORY SUBCOMMITTEE VISION STATEMENTS • TIME FOR LEARNING – REMOVE BARRIERS • COMPETENCY BASED EDUCATION – LOOK AT OUTCOMES, NOT BEING DEFINED BY GRADE OR AGE • SCHOOL PARTNERSHIPS WITH COMMUNITY MEMBERS/PARENTS/AGENCIES/HIGHER EDUCATION • PROVIDE MEANINGFUL, PRACTICAL APPLICATION SKILLS THROUGH ASSIGNMENTS/PROJECTS • HIGH QUALITY INSTRUCTION – MORE ENGAGEMENT/INTEREST, MEETING THE NEEDS OF ALL LEARNERS • UTILIZING RESOURCES, CREATING SELF-DIRECTED LEARNERS • HIGH LEVELS OF ACCOUNTABILITY FOR STUDENTS AND STAFF • CREATING OPPORTUNITIES THROUGH INDIVIDUALIZED EXPERIENCES TO ENCOURAGE SELF DIRECTED LEARNING
SIX FACETS • Student Achievement • Quality Teaching / Quality Staff and Strong Instructional Leadership • Technology • Facilities • Operations • Community Engagement Dr. Hibner (2011)
HEAD COUNT Headcount includes resident and non-resident students enrolled within the district. Headcount excludes resident students enrolled outside the district and in alternative and special education placements. The enrollment numbers in the following charts are as of September of each year, except for the estimate for the current year.
GENERAL FUND & FD 27 SALARIES & BENEFITS 2011-12 SCHOOL YEAR
Salary/Benefit Distribution by Staff Support Staff Support Staff Teachers Admin/Supv Teachers Admin/Supv Basic Salary/Benefits Only – does not include extra duties.
MILL RATE HISTORY(11-12 – Estimate) See Appendix “Rock Valley Athletic Conference 2009-10 Equalized Tax Levy Information” for Comparables
% Change in Equalized Value History(11-12 – Estimate) See Appendix “WI DPI Analysis of General Aid and Equalization Aid Formula Components” for Comparisons to State Increases
2010-11 Tax Levy By Municipality See Appendix “Tax Bill Analysis” for steps to understand the components of a tax bill.
OPERATIONALACCOMPLISHMENTS • Addressed the 2.0 million dollar shortfall • Kept focus on quality staff – salaries, insurance, premiums, etc. • Altered language to support high quality systems • Attempted to maintain class sizes and programming • AD – HOC Facilities Subcommittee • Continued upgrades to facilities and energy efficiency recognition Dr. Hibner (2011)
ACADEMIC ACCOMPLISHMENTS • Wisconsin High School Teacher of the year • High WKCE marks in comparison to surrounding districts • Attempted to maintain class sizes and programming • Continuation of virtual course offerings and assessing implementation of more course offerings • Implementation of “Second Chance Partners for Education” • Birth to Four Initiative • 21st C. Advisory Subcommittee • PBIS implementation • Development of a systemic BCT process • Continued improvement on our focus on student learning growth Dr. Hibner (2011)
RESULTS LEARNING GROWTH AND ATTAINMENT HIGH GROWTH / HIGH GROWTH / HIGH ATTAINMENT LOW ATTAINMENT LOW GROWTH / LOW GROWTH / HIGH ATTAINMENT LOW ATTAINMENT
RESULTS - MAP • 2005 Norms Study with Northwest Evaluation Association has concluded that a school district is successfully helping students to improve their annual achievement levels, if 50% or more of the students in the District reach their individual targeted growth goal for the school year.
RESULTS • Reading – 7 of 7 grade levels (2 – 8) had above 50% of students meet targeted growth for 2010 – 2011 school year per MAP results. • Reading – 2009 – 2010 school year our overall percentage was 61.5% of students met their typical growth target and for the 2010 – 2011 school year our overall percentage was 67.7% per MAP results.
REMINDER • In the top 10% of schools nationally, about 60 - 70 percent of the students reach their growth norm target in reading. • 2009 – 2010 (61.5%) • 2010 – 2011 (67.7%)
RESULTS • Reading – of 7 grades ( 3- 8 and 10), overall percentage of students scoring proficient and or advanced on WKCE was 88% for 2010 – 2011 school year.
RESULTS of COHORT • Reading – of 6 grades (excluding 2nd grade), 4 of 6 cohorts increased their overall percentage of students meeting norm target growth per MAP. • Reading – of 7 grades (3 – 8 and 10), 5 of 7 cohorts increased their overall percentage meeting attainment for proficiency and or advanced per WKCE.
RESULTS • Math – 5 of 7 grade levels (2 – 8) had above 50% of students meet targeted growth for 2010 – 2011 school year per MAP results. • Math – 2009 – 2010 school year our overall percentage was 64.3% and for the 2010 – 2011 school year our overall percentage was 61.2% per MAP results.
RESULTS • In the top 10% of schools nationally, about 65 - 75 percent of the students reach their growth norm target in mathematics. • 2009 – 2010 (64.3%) • 2010 – 2011 (61.2%)
RESULTS • Math – of 7 grades ( 3- 8 and 10), overall percentage of students scoring proficient and or advanced on WKCE was 86% for 2010 – 2011 school year.
RESULTS of COHORT • Math – of 6 grades (excluding 2nd grade), 2 of 6 cohorts increased their overall percentage of students meeting norm target growth per MAP. • Math – of 7 grades (3 – 8 and 10), 1 of 7 cohorts increased their overall percentage meeting attainment for proficiency and or advanced per WKCE.
RESULTS ofExplore / PLAN / ACT ACT SCORES Reading English Math Science Composite Student % 07 – 08 22.6 21.4 21.5 22.1 22 55.6% 08 – 09 22.4 20.8 21.4 22.1 21.9 61.8% 09 - 1022.8 21.9 21.9 22.5 22.4 69% 10 – 11 22.7 21.1 21.8 22.4 22.2 62.3% State Avg. 22.2 21.6 22.1 22.3 22.2
RESULTS ofExplore / PLAN / ACT • Explore Scores (9th grade) for 2010 – 2011 school year: Reading English Math Science Composite 16.2 17 17.4 18.4 17.3 National Avg. 15.3 15.5 16.3 16.5 16.1 • PLAN Scores (10th grade) for 2010 – 2011 school year: 18.7 18.2 19.9 20.3 19.4 National Avg. 17.2 17.4 17.8 18.3 17.8
Results of 2010 – 2011 ACT • East Troy - (62.3%) / 22.2% • Mequon – Thiensville – (89%) / 25.6% • Elmbrook – (87%) / 25.2% • Arrowhead – (83.3%) / 24.8% • Kettle Moraine – (81.3%) / 23.8% • Mukwonago – (67.1%) / 23.4% • Waterford – (71.5%) / 22.9% • Waukesha – (57.1%) / 22.9% • Burlington – (57.3%) / 22.4% • Elkhorn – (60.8%) / 21.8% • Whitewater – (65.8%) / 21.6%
RESULTS of COHORT • Graduating Class of 2012 ACT Reading English Math Science Composite Student % 10 – 11 22.7 21.1 21.8 22.4 22.2 62.3% Explore 08 – 09 16.2 17 16.7 17.7 17 100%
RESULTS of COHORT • Graduating Class of 2013 PLAN Reading English Math Science Composite Student % 10 – 11 18.7 18.2 19.9 20.3 19.4 100% Explore 09 – 10 17 17.1 17.9 18.7 17.8 100%
Additional Results • District Data Points – attendance, truancy rate, drop out rate, suspensions, expulsions, retention rate, high school completion rates, open enrollment students, home-schooled students, ELL students, gifted and talented, special education, extra-curricular, etc. • PBIS (Positive Behavioral Interventional Strategies) • YRBS (Youth Risk Behavior Survey) • School Perceptions Senior Survey
VII. ANNUAL VOLUNTARY SERVICE TO EDUCATION AWARDS Congratulations and Thank You to: MarolynKomperud
VIII. TREASURER’S REPORT –2010-11 Budgeted Unaudited Variance EXPENDITURES General Fund 18,463,702 18,220,051 (243,651) Special Education Fund 1,834,482 1,831,862 (2,620) Debt Service Fund 1,255,078 1,255,078 0 REVENUES General Fund 18,463,702 18,507,772 44,070 Special Education Fund 1,834,482 1,831,862 (2,620) Debt Service Fund 1,239,624 1,239,658 34 Total fund balance increase of $287,721
11-12 Key Aspects of REVENUES • STATE BUDGET – per pupil revenue limit decrease of -$534.42, state aid decrease of -10% due to hold harmless provision at 90% of previous year’s aid • Projected Revenue Limit on July 1: $16,124,084: • -7.01% DECREASE • $4,102,545 state aid (-10%) • $12,021,539 Fd 10 property taxes (-5.89%) • Overall levy: $13,566,453 (-2.76%)
11-12 Key Aspects of Shortfall Projected Shortfall: $689,000 original based on $200 per pupil revenue limit formula Additional Shortfall: $1,285,000 from State Budget Reductions TOTAL SHORTFALL = Nearly $2,000,000
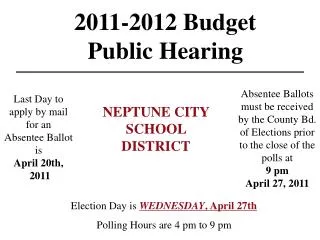
X. BUDGETHEARING By S. 65.90Wis. Stats, common school districts must hold the public budget hearing at the time and place of the annual meeting. Residents have an opportunity to comment on the proposed budget.
School District Funds 10 General Fund -Used to record district financial activities for current operations, except those activities required to be accounted for in separate funds.
School District Funds • 20 Special Project Funds • 21Special Revenue Trust Fund • Gift / Donations Fund – prudent when project directed by donation will cross fiscal years. • 27 Special Education Fund • Exceptional Educational Needs/Federal Handicapped/Other Special Projects
School District Funds • Debt Service Funds • Irrepealable debt tax levy and related revenues. • Principal, interest, and related long-term debt retirement. • 39 Referendum Approved Debt Service
School District Funds 50 Food Service Fund Federal regulations require separate accounting for Food Service. Fund deficit must be eliminated through transfer from the General Fund. Fund balance must be retained for use in Food Service.
School District Funds 70 Trust Funds These funds are used to account for assets held by the district in a trustee capacity for individuals, private organizations, or other governments. East Troy utilizes this fund for its scholarship donations.
School District Funds 80 Community Service Fund Fund established through S. 120.13 and 120.61, Wis. Stats. Allows a school board to permit use of district property for civic purposes. Examples of activities could include adult education, community recreation programs, and/or day care services.
LONG TERM DEBTAs of September 1, 2011 • Remaining principal on Fund 39 - $6,435,000 (Debt Expires 3/1/2018). • REFERENDUM UPDATE – 10-11 was the final 5th year of the second, 5 year referendum.
RESOLUTIONS(Last page of booklet) XI. Resolution A: Adoption of Tax Levy XII. Resolution B: Salaries for Board of Education Members XIII. Resolution C: Set Date and Time for 2012 Annual Meeting