Download
1 / 14
140 likes | 590 Vues
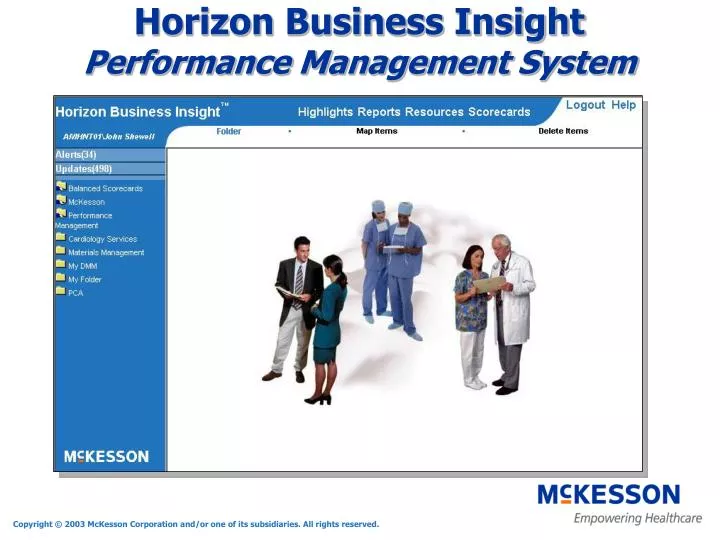
Horizon Business Insight Performance Management System. Single point of acce s s to consolidated management information Executives, managers, analysts Web-based interactive analysis Multidimensional drilldown Data manipulation (rank, qualify, filter)

E N D
Horizon Business Insight Performance Management System
Single point of access to consolidated management information Executives, managers, analysts Web-based interactive analysis Multidimensional drilldown Data manipulation (rank, qualify, filter) Beyond Reports… Highlights key performance measures Graphs, control charts, tables, interpretations Alerts, thresholds, E-mail notification Scorecards with Radar Charts Diverse data sources Decision support, operational systems, other documents (HTML, Word, Excel, PDF, Text, etc.) Horizon Business Insight
Single unified point of access for organizational performance information Automates reporting “scorecards” against strategic and tactical objectives Proactive alerts focus managers’ attention on critical issues Built-in analysis tools enable quick identification of problems and issues Horizon Business Insight
Standardand Personalized Views - Users can access standard folders or customize their Web page view by using personal folders to meet their unique needs. Descriptions - Electronic post-it notes allow users to view customized information about Highlights, Reports and Resources. Status - New, Update and Alert icons are automatically displayed when new information is available.
Resources - Incorporate multiple sources of information, including Microsoft Excel, Word, PowerPoint, Project, Access and Binder, WinZip, Crystal Reports, Adobe PDF, ASCII, HTML documents – and more.
Highlights - Contain multidimensional, modifiable views that are presented as graphs, tabular reports and text interpretations. In this Patient Satisfaction analysis, drilling to physician indicates a possible correlation between ICD-9 procedure and patient satisfaction.
Alerts and E-Mail Notification - Horizon Business Insight alerts automatically inform users via e-mail when critical performance measures are outside of acceptable ranges. Highlights can be accessed from the user’s Horizon Business Insight folders, via a scorecard or from an automated email alert. Horizon Business Insight will automatically trigger an alert - previously defined by the department manager - and send an e-mail to the responsible manager. By clicking on the highlight name in the email, the manager is brought directly to the highlight.
DynamicInformationReview - Users drill to supporting levels of detail and manipulate the data to answer questions as they arise. Columns can be sorted in descending or ascending order. In this example, we drill into the Net Income line on the scorecard. A highlight displaying Net Income by Payor displays. From here we drill into the Oxford MA bar by clicking on the graph. This reveals a potential concern in the General Surgery area.
Modify- Users dynamically change drill order and reorganize the view of data to facilitate analysis “on the fly.” Qualify- Users interactively qualify highlights to trim the data and focus their analysis. Drilling into Cardiology reveals a net income loss in PTCV, but the next drill level is Attending Physician. To view more meaningful information – such as cost per case by attending physician – simply deselect the Net Income from the display area and select Cost/Case. Further refining the analysis, the data is qualified to show only Medicare cases. We can see that Dr. Emerson and Dr. Duncanson have notably higher costs than their peers. Further analysis may be warranted.
Revenue Cycle Performance Table View
Operational Performance Management – CEO Radar Chart View
Other Systems Desktop Files Excel Word HTML PDF Text HBI Data Flow Data Sources Shared Folders On HBI Server HBI Web Sites \\server\WTFiles ASCII flat file exports Subset Definition Source Files Subset Editor Site http://server/wtsubset Create subset definition Import into subset Highlight Editor Site http://server/wthighlight Create and edit highlights Scorecard Editor Site http://server/wtscorecard Create and edit scorecards WBT files (FTP or NFS file transfer) Viewer Site http://server/hbi_viewer Administrator Site http://server/wtadmin \\server\WTReports HPM or Trendstar Report Files Refresh • View highlights, resources, reports, scorecards, and alerts • Create personal folders and map report objects to them • Create private alerts • Set personal viewing preferences • Export data WTR files (FTP or NFS file transfer) Highlights Scorecards Reports • Maintain user and group accounts • Grant functional privileges • Assign object viewing privileges • Map objects to public folders • Administer entities • Create public alerts • Refresh reports and resources \\server\Resource\1.7 Extract to flat file for subset Resources • Resource Files • (Excel, html, • Pdf, Word, • text) Refresh Copy