Download
1 / 31
310 likes | 389 Vues
Determination of g/g from Hermes High-p T hadrons. P.Liebing, RBRC, For the Hermes Collaboration. Spin 2006, Kyoto, Oct. 2006. Outline. Data sets and asymmetries Monte Carlo studies Extraction of g/g: Methods Extraction of g/g: Results. Data Set(s).

E N D
Determination of g/g from Hermes High-pT hadrons P.Liebing, RBRC, For the Hermes Collaboration Spin 2006, Kyoto, Oct. 2006
Outline • Data sets and asymmetries • Monte Carlo studies • Extraction of g/g: Methods • Extraction of g/g: Results
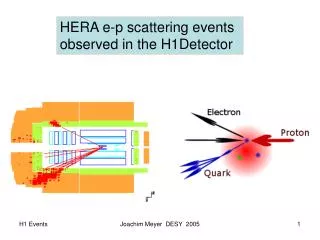
Data Set(s) • “antitagged”, inclusive charged hadrons • Deuteron target (from 2000) • Antitagged = Positron veto • Disclaimer: This is NOT quasi-real photoproduction! • Asymmetries vs. pT(beam) (pT w/respect to beam axis) • Other data sets from different target (proton), kinematic region (semiinclusive, Q2>0.1 GeV2), selection (hadron pairs) for consistency check of final result • Results consistent within statistics
Measured Asymmetries • Antitagged Data: Compare measured asymmetries to asym-metries calculated from MC using g/g = 0 (central curve) g/g = -1 (upper curve) g/g = +1 (lower curve) The g/g=0 asymmetry shows the contribution of the quarks!
Monte Carlo • Pythia 6.2 is used to provide the additional info needed to extract g/g from asymmetries • Relative contributions R of background and signal subprocesses in the relevant pT-range of the data • Background asymmetries and the hard subprocess asymmetry of the signal processes • Subprocess type, flavors and kinematics of partons • MC Asymmetries are calculated event by event and then averaged over the relevant pT-range • !
QCD 22 Pythia: Reminder • Pythia simulates the total ep (*p) cross section using a mixture of different subprocesses • VMD (exclusive, diffractive, soft nondiffractive, hard nondiffractive) • Anomalous ( ) processes • Direct photon processes (QCDC, PGF) • LO DIS
Monte Carlo vs. Data • Integrating over pT, data and MC cross sections agree within 10-20% Observed Cross Section vs. pT • Reason for disagreement at pT>1GeV: Increasing weight of NLO corrections K-factors for hard QCD subprocesses according to B. Jäger et. Al., Eur.Phys. J. C44(2005) 533
Monte Carlo: Fractions and Asymmetries Subprocess Asymmetries (using GRSV std.) Subprocess Fraction • VMD decreasing with pT • DIS increasing with pT • Hard QCD increasing with pT • Signal Process PGF&QCD2->2 • have same magnitude • DIS increasing with pT(x) - positive • |PGF| increasing with pT - negative • All others flat and small, but: • Important for background asymmetry!
Everything else (hard, soft) Contribution from hard gluons in nucleon ~ g/g g/g Extraction • Extraction: Compare measured asymmetry with MC calculated one: • 2 Methods to account for the different x distributions folded into the signal asymmetry (cross section, hard subprocess asymmetry and g/g)
g/g Extraction: Method 1 • Method 1: Assume that g/g(x) is flat or only very weakly dependent on x • Then: • And:
g/g Extraction: Method 2 • Use • And minimize the difference between and • By fitting a function for g/g(x). • Use scan over parameters of function to find the minimum 2. • Scale (Q2) dependence of g/g(x, Q2) ignored absorbed into scale uncertainty (see later)
g/g Results • Mean g/g from function: 1.05 < pT < 2.5 GeV (deuteron, antitagged, 4 pT bins) • error bars/bands: stat. and total errors (see later) • For Method 2 the errors are correlated (100%) through the fit parameter • Method 1 and 2 agree for the average of the data, determined by lowest pT points
g/g Systematics • Uncertainties from each of 3 (4) groups • MC parameters • Pol./unpol. PDFs • Low-pT asymmetry • (Method 2 only) Fit function choice (1 or 2 params.) Summed linearly to “Models” uncertainty • Hopefully this conservative approach would also cover for the unknown uncertainties due to • Using a LO approximation • Using Pythia as a model • Experimental (stat.+syst.) added in quadrature • syst. uncertainty from 4% scaling uncertainty 14% on g/g
Final Results&Conclusions • Hermes point (averaged over pT) from Method 1, curves for two fit functions • g/g is (likely) mostly small or even negative(?) • There is a slight hint that it may be positive, and larger at large x • Systematic errors have been investigated in depth • Need more data within really large x range to learn more
g/g Extraction: x-distributions • Unpolarized cross section vs. x from Pythia for antitagged data: • Hard subprocess asymmetry distribution: • g/g(x)? Data cover 0.07<x<0.7, most sensi-tive in 0.2<x<0.3
g/g Results: Method 2 • Final 2 functions used are polynomials with 1(2) free parameters • Fix g/gx for x0 and g/g1 for x1 (Brodsky et al.) • |g/g(x)|<1 for all x • Difference between functions is systematic uncertainty Fit results • Light shaded area: range of data • Dark shaded area: center of gravity for fit
g/g Results: Method 2 • 2/ndf5.5: highest pT point • Systematics not included in fit • 1 or 2 parameter function cannot change rapidly enough to accommodate highest pT-bin MC and data asymmetries for pT>1.05 GeV
g/g(x) Results: Method 2 • x-dependence of g/g can only be determined unambiguously from Method 2 using the Mean Value Theorem for Integrals: • Approximation for Method 1: <x> (Method 2)
g/g(x) Results: Method 2 • g/g at average x (Method 1 and 2) and vs. x (Method 2) for corresponding 4 pT points: error bars/bands: stat. and total errors (see later) Method 1 and 2 agree for the average of the data
1.05 1.0 2.0 Lower cuts on pT g/g Extraction: Cuts • Cuts are defined to balance statistics with sensitivity (S/B ratio) • Also possible systematics under consideration • Important: Correlation between measured pT and hard pT (x, scale)
Systematics: PDFs • Standard PDFs used: • CTEQ5L(SaS2) for Pythia (unpol., Nucleon(Photon)) • GRSV std./GRV98 for q/q going into asymmetries • Variation: • GRV98(GRS) for Pythia (unpol, Nucleon(Photon)) • GS-B/GRV94, BB2006/CTEQ5L for q/q(nucleon) going into asymmetries • Error: • For Pythia (unpol) the difference is taken as a 1 error • For q/qI(nucleon) the maximum difference is taken as a 1 error
Systematics: Asymmetries • Besides PDFs, there are 2 more sources of uncertainties • Asymmetry of “low-pT” VMD process • Std: Alow-pT=Ainclusive (from fit to g1/F1) • Variation: Alow-pT=0 (!asymmetric error!) • Unknown polarized photon PDFs needed for hard resolved processes • Std: Arithmetic mean of maximal and minimal scenarios of Glück et. al., Phys. Lett. B503 (2001) 285 • Variation: maximal and minimal scenarios (symmetric, 1 error)
Systematics: pT smearing • Initial state (intrinsic kT of partons in nucleon and photon) and final state (fragmentation) radiation generate additional pT with respect to the collinear “hadron pT” , . • Huge effects on measured cross sections, and the correlation between measured pT and hard subprocess pT , and x • Also large effects on subprocess fractions • See Elke’s study in the paper draft • Std.: kT (0.4 GeV) and pTFragm. (0.4 GeV) from 2 minimization • Variation: 1 error from 2 minimization (0.04/0.02 GeV)
Systematics: Scale Dependence • Scale in Pythia was varied by factors 1/2 and 2 • Same variation for asymmetry calculation • Error: Maximum difference to std. is taken as 1 uncertainty
Systematics: Cutoffs • A number of cutoffs in Pythia (to avoid double counting) can influence subprocess fractions • Most important one: PARP(90) sets the dividing line between • PGF/QCDC and hard resolved QCD • Hard and soft (low-pT) VMD • Std: Default Pythia (0.16) • Variation: 0.14-0.18 (from comparing Pythia LO cross section with theory LO cross section)
Systematics: Method 2 • An additional uncertainty is assigned for Method 2 due to the choice of functional shape • Std: Function 1 (1 free parameter) • Variation: Function 2 (2 free parameters) • Error = difference (!asymmetric!)
MC vs. (N)LO pQCD? • Why can we not (yet) use NLO pQCD calculations to extract g/g? • Example: simple PGF process (LO) • Magenta curves are what LO pQCD would give • Dashed curves are for intrinsic kT is included (0.4 GeV) • Solid curves are intrinsic and fragmentation pT (0.4 GeV) included pT (of the hard subprocess) and x distributions Cross sections
MC vs. LO QCD • Comparison of LO cross section for hard subprocesses from pQCD (M. Stratmann) and MC (no JETSET, Kretzer FF instead) • Magenta lines: Results from varying scale • Scale definition different for MC and calculation
Monte Carlo vs. Data • Pythia code has been modified/Parameters adjusted to match our exclusive (Q2>0.1) and semiinclusive data (Q2>1) Comparison of observed cross sections in tagged region Data + MC agree well within 10-20% for variablesintegrated over pT
Polarized and unpol. cross sections and k factors (B. Jäger et. al., Eur.Phys. J. C44(2005) 533) Monte Carlo vs. Data Comparison of observed cross sections in antitagged region (vs. pT(beam)) Data + MC agree vs. pT when taking NLO corrections into account