Download

1 / 22
230 likes | 317 Vues
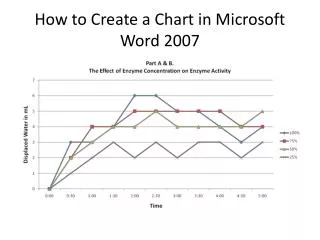
How to make a graph in Microsoft word. Rogelio rodriguez. First Step: Open a Microsoft Word document and save it by the name of your choice. Second Step: Click on “INSERT”. Once you have clicked on “INSERT,” click on “CHART.”. After clicking on “CHART,” you should see the window below. .

E N D
How to make a graph in Microsoft word Rogelio rodriguez
First Step: Open a Microsoft Word document and save it by the name of your choice.
After clicking on “CHART,” you should see the window below. Choose this bar graph. Then click on “OK.”
Once you click “OK,” the Microsoft Word document should shrink to half its size, and a Microsoft Excel spreadsheet should open up with some sample data as shown below.
The Excel spreadsheet that opened up right next to the word document is linked to it, so any changes that you make to the data in the spreadsheet will change in the WORD document. Also, since you are adding more than 4 values to the spreadsheet, make sure to drag the lower right corner of the range.
Some of you may not know how to drag the corner of the range. Place your cursor on the corner of the range, which is the blue line, left click on the corner, and drag it down to desired the range. As you can see a little black arrow has appeared when you left click the mouse.
As you start dragging the edge, you will see a dotted gray line appear and extend to where you move the cursor.
Now you need to change the values in the spreadsheet that read “CATEGORY 1,2, 3,4, etc…” to the scores which are 1, 2, 3, 4, 5, 6 & 7. As you can see below, the values on the WORD document have changed.
Repeat the steps from the previous slide to change the values from “SERIES 1, SERIES 2, etc.” to “MALE & FEMALE. Also, you need to delete column D. See the following slide.
To delete column D you need to click on the column once, then right click and choose delete from the list of options. Once you right click on top of the column, these set of options should appear, so just click on delete and that’s it.
When you are changing the values under female & male, you will get this error box. Just press “OK.” After pressing ok close the Microsoft Excel window and go to your Microsoft Word window. Then right click on the graph and select “EDIT DATA.” The error box will no longer appear.
After deleting column D and changing the values, your chart should look similar to the one below.
After modifying your spread sheet and depending on your data, your chart in the Word doc should look similar to this.
Now you need to label the chart. Chart and axis titles need to be given. To do this you need to go to “CHART TOOLS.” To do so click on the chart just once. When you click on the chart once, “CHART TOOLS” should appear as shown here. Click in this area. Do you see how the chart is now outlined and up above MS WORD is displaying “CHART TOOLS”?
Our next step is to click on “LAYOUT” Now, click on “CHART TITLE” to change chart title. Finally, click on “AXIS TITLE” to change axis title.
Choose from the options given so you can design your labels.
Your chart should resemble the chart below after you have finished editing the labels.
Now, if you want to change the color of the chart, click on “DESIGN” & choose your color.
Once you are done modifying your chart, you can insert it into a document by copying and pasting it. Click once on the chart, right click and choose “COPY.” Then “PASTE” it in your essay.