Download

1 / 9
110 likes | 234 Vues
WRITING TASK 1 Jan 2 nd 2013. … continued TABLES. Language input 2. EXPRESSING NUMBERS. Numbers with Decimals (.) 548.6632 → five hundred forty-eight point six six three two ” Numbers after the decimal point are read individually. Percentages 86 % → eighty-six percent

E N D
WRITING TASK 1Jan 2nd 2013 … continued TABLES
Language input 2 EXPRESSING NUMBERS
Numbers with Decimals (.) 548.6632 → five hundred forty-eight point six six three two” Numbers after the decimal point are read individually. Percentages 86% → eighty-six percent Fractions 3/8 → three-eighths ¼ → a quarter ½ → a half 2/3 → two-thirds. Some more numbers 80km/h →Eighty kilometers per hour 27ºC → twenty-seven degrees celsius
Use hyphens in the following: • Compound numbers • Example: • Forty-four people registered last week and another • 57 registered yesterday. • Spelt out fractions • Example: • Only one-half of the food was eaten. • Just over two-thirds of the paper has been used.
Activity 3 Part I: Study the table and decide whether the statements which follow are true or false or if it is impossible to tell from the data. Choose T / F / NG. Part II: All the phrases below can be used to describe figures. Group them into phrases which mean the same.
ANSWERS: Part I 1) The table shows the number of people in Great Britain who used the Internet.T / F / NG 2) The table shows the percentage of people in Great Britain who used the Internet between July and October each year. T / F /NG 3) The table shows decreases in percentage from October 2000 to October 2005. T /F / NG 4) In October 2000, more 16 to 24 year olds used the Internet than 25 to 44 year olds.T / F / NG
5) The lowest percentage of Internet use was in June 2002. T / F /NG 6) In October 2004, only forty-eight 55 to 64 year olds used the Internet. T / F /NG 7) 10 percent of 45-54 year olds did not use the Internet in October 2001. T /F / NG 8) The percentage of people in Great Britain who used the Internet fluctuated over the five years. T /F / NG
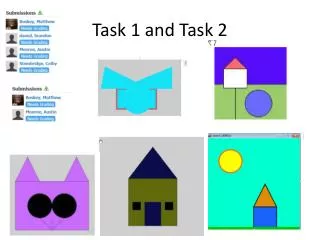
LET’S CONTINUE PROCESS: DIAGRAMS AND FLOWCHARTS