Download
1 / 32
910 likes | 2.84k Vues
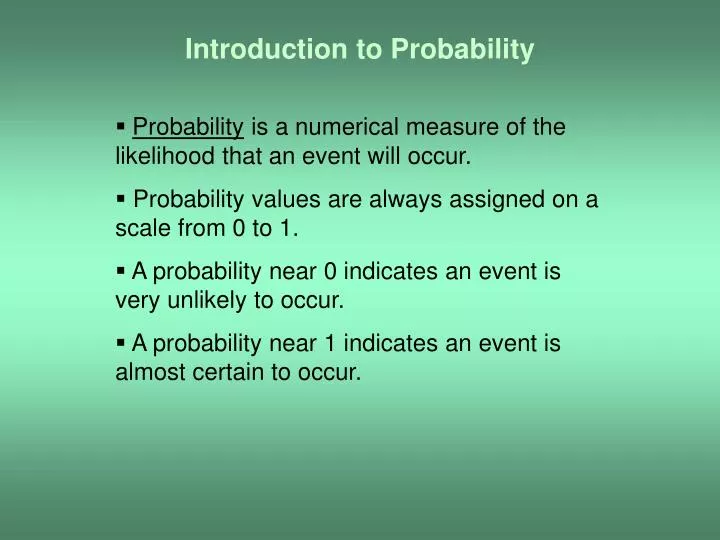
Introduction to Probability. Probability is a numerical measure of the likelihood that an event will occur. Probability values are always assigned on a scale from 0 to 1. A probability near 0 indicates an event is very unlikely to occur.

E N D
Introduction to Probability Probability is a numerical measure of the likelihood that an event will occur. Probability values are always assigned on a scale from 0 to 1. A probability near 0 indicates an event is very unlikely to occur. A probability near 1 indicates an event is almost certain to occur.
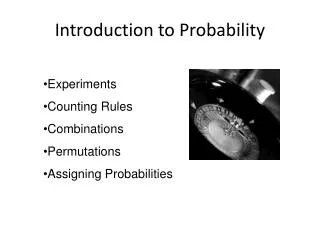
Experiments, Sample Spaces, and Events An experimentis the process of obtaining observations or measurements. The sample space for an experiment is the collection of all experimental outcomes. An event is a portion of a sample space, that is a collection of sample points.
Assigning Probabilities Relative Frequency Method Assigning probabilities based on experimentation or historical data. Classical/Theoretical Method Assigning probabilities based on the assumption of equally likely outcomes. Subjective Method Assigning probabilities based on the assignor’s judgment.
Assigning ProbabilitiesRelative Frequency Method The probability of event E is denoted by P(E) and is the proportion of the time that E can be expected to occur in the long run.
Relative Frequency Method If we let E be the event E: a female birth in the United States then the probability of E is estimated to be
Assigning Probabilities Classical Method Suppose a sample space has s equally likely points, and E is an event consisting of e points. Then
Classical Method The sample space of the experiment is (a,a) (a,b) (a,c) (b,a) (b,b) (b,c) (c,a) (c,b) (c,c) The sample space has s = 9 equally likely outcomes.
Classical Method The event of interest is E: both answers are correct Event E contains e=1 point. Therefore, by the classical method of assigning probabilities, the probability that the student will answer both questions correctly is
Assigning Probabilities Subjective Method When economic conditions and a company’s circumstances change rapidly it might be inappropriate to assign probabilities based solely on historical data. We can use any data available as well as our experience and intuition, but ultimately a probability value should express our degree of belief that the experimental outcome will occur. The best probability estimates often are obtained by combining the estimates from the classical or relative frequency approach with the subjective estimates.
Basic Techniques for Counting Sample Points The Multiplication Rule The Combination Formula The Permutation Formula
Techniques for Counting Sample PointsThe Multiplication Rule • If an experiment consists of a sequence of k steps in which there are n1 possible outcomes for the first step, n2 possible outcomes for the second step, and so on, then the total number of experimental outcomes is given by (n1)(n2) . . . (nk).
The Multiplication Rule The 1st question can be answered in 2 ways: n1 = 2 The 2nd question can be answered in 2 ways: n2 = 2 The 3rd question can be answered in 2 ways: n3 = 2 The 4th question can be answered in 2 ways: n4 = 2 The 5th question can be answered in 2 ways: n5 = 2 Then, the number of ways the five questions can be answered is n1 * n2 * n3 * n4 * n5 = 2*2*2*2*2 = 32
The Multiplication Rule The soup can be selected in 3 ways: n1 = 3 The sandwich can be selected in 2 ways: n2 = 2 Then the beverage chosen in 4 ways: n3 = 4 Therefore, the number of ways the luncheon special can be selected is n1 * n2 * n3 = 3*2*4 = 24 A helpful graphical representation of a multiple-step experiment is a tree diagram.
Tree diagrams The construction of the tree diagram is started by drawing a set of main branches, one for each of the three ways that the soup can be selected. Next, off each of the three main branches draw two secondary branches to show the ways that the sandwich can be selected. Finally, from each of the secondary branches construct a third set of four branches to show the ways that the beverage can be chosen. By following all possible paths from the beginning point to the ending points, we can obtain all possible ways of selecting the luncheon special.
Tree diagrams Soup (1st step) Sandwich (2nd step) Drink (3rd step)
Techniques for Counting Sample PointsThe Combination Formula Another useful counting rule enables us to count the number of experimental outcomes when k objects are to be selected from a set of n objects. It is called the combination formula.
Techniques for Counting Sample PointsThe Combination Formula C(n,k) denotes the number of combinations of k selected from n. It gives the number of ways that k items can be selected from n items, without regard to the order of selection. where n! = n(n - 1)( n - 2) . . . (2)(1) k! = k(k - 1)(k - 2) . . . (2)(1) 0! = 1
The Combination Formula Example Determine the number of ways in which a manufacturer can choose 2 of 7 locations for a new warehouse. Solution: We need to determine the number of ways 2 items can be chosen from the 7 possibilities. Therefore, the solution to the problem is the number of combinations of k=2 items selected from n=7. Applying the Combination Formula, we have:
The Combination Formula Example Thus,there are 21 ways in which a manufacturer can choose 2 of 7 locations for a new warehouse.
The Combination Formula Example We need to determine the number of ways six numbers can be chosen form the 40 possibilities. Therefore, the solution to the problem is the number of combinations of 6 numbers selected from 40. Then k = 6 n = 40 Applying the Combination Formula, we have:
The Combination Formula Thus, there are 3,838,380 possible lottery tickets.
Permutations • The number of permutations of a subset of r elements selected from a set of n different elements is • The number of permutations of n different elements is n! where
Probability Rules There are some basic probability relationships that can be used to compute the probability of an event without knowledge of all the sample point probabilities. The Complement Rule of Probability The Addition Rule of Probability The Multiplication Rule of Probability The Condition Rule of Probability
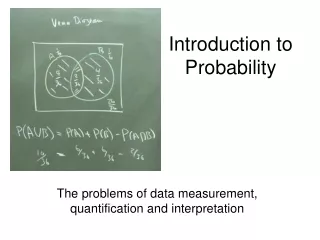
Probability Rules The Complement Rule of Probability The complement of an event A is defined to be the event consisting of all sample points that are not in A. The complement of A is denoted by . The Venn diagram below illustrates the concept of a complement. Event A
The Complement Rule of ProbabilityExample Consider the following sample space: S = {0, 1, 2, 3, 4, 5, 6, 7, 8, 9} and the events A = {0, 2, 4, 6, 8}, B = {1, 3, 5, 7, 9}, C = {2, 3, 4, 5}, D = {1, 6, 7} List the elements of the sets corresponding to the events given by your instructor.
Probability Rules The Addition Rule of Probability The union of events A and B is the event containing all sample points that are in A or B or both.
Probability Rules The Addition Rule of Probability The probability that event A or B will occur when an experiment is performed is given by P(A or B)=P(A) + P(B) – P(AB) where P(AB) is the probability that both events, A and B, will occur. In set notation, event A or B is , the union of A with B.
The Addition Rule of ProbabilityMutually Exclusive Events A and B are mutually exclusive events if both cannot occur together in the same experiment. Consequently, P(AB)=0 The Additional Rule for Mutually Exclusive Events: If A, B, C, … are mutually exclusive events, then P(A or B or C or …) = P(A)+P(B)+P(C)+ …
Probability RulesThe Multiplication Rule of Probability • The probability that both A and B will occur when an experiment is performed is given by P(AB)=P(A)*P(B|A), where P(B|A) is the probability of B if A has occurred, and it is called the conditional probability of B given A.
Independent Events • Events A and B are independent if the probability of each event is not affected by whether or not the other event has occurred. • The Multiplication Rule for Independent Events: • If A, B, C, … are independent events, then • P(ABC …)=P(A)*P(B)*P(C)* …
Independent Events Test for Independent Events: A and B are independent if either P(A|B) = P(A) or P(AB)=P(A)*P(B). Otherwise, the events are dependent.
Probability Rules The Condition Rule of Probability The conditional probability of B, given that A has occurred, is given by