1 / 12

Graphic formats (1)

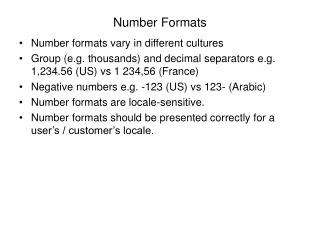
Graphic formats (1). Dr. Lily Díaz Professor Aalto University School of Art and Design Department of Media, Media Lab 13 February 2014. Simple bar graph. Grouped paired bar graph. 100% stacked bar graph. Simple column chart. Grouped column chart. Overlapped column graph.

Télécharger la présentation

Graphic formats (1)

An Image/Link below is provided (as is) to download presentation Download Policy: Content on the Website is provided to you AS IS for your information and personal use and may not be sold / licensed / shared on other websites without getting consent from its author. Content is provided to you AS IS for your information and personal use only. Download presentation by click this link. While downloading, if for some reason you are not able to download a presentation, the publisher may have deleted the file from their server. During download, if you can't get a presentation, the file might be deleted by the publisher.

E N D

Presentation Transcript


  1. Graphic formats (1) Dr. Lily Díaz Professor Aalto University School of Art and Design Department of Media, Media Lab 13 February 2014

  2. Simple bar graph

  3. Grouped paired bar graph

  4. 100% stacked bar graph

  5. Simple column chart

  6. Grouped column chart

  7. Overlapped column graph

  8. 100% stacked column graph

  9. Histogram

  10. Change bar graph

  11. Deviation bar graph

  12. Break even chart

More Related