Download
1 / 45
460 likes | 579 Vues
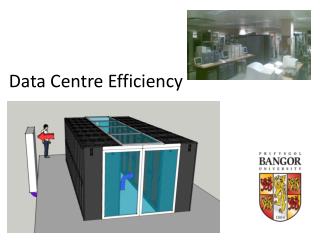
Data Centre Best Practises Workshop. Using Computational Fluid Dynamics (CFD) for improving cooling system efficiency for Data centers. Shishir Gupta. 17 th March 2009. You are Here ↓. Introduction to CFD. Data Centre Case Study – Geometrical Details. CFD while designing of HVAC system.

E N D
Data Centre Best Practises Workshop Using Computational Fluid Dynamics (CFD) for improving cooling system efficiency for Data centers Shishir Gupta 17th March 2009
You are Here ↓ Introduction to CFD Data Centre Case Study – Geometrical Details CFD while designing of HVAC system CFD during installation of Data Centre CFD for maintenance of Data Centre – Feedforward System
Introduction to CFD • Computational (having to do with mathematics & computation) Fluid Dynamics (the dynamics of things that flow) • CFD is built upon fundamental physics equations: equations of motion and conservation. CFD applications range from numerical weather prediction to vehicular aerodynamics design. • CFD applications are linked with advances in computing software and hardware. CFD software is characterized by the physical models in the software. • Fine-scale CFD applications closely match the true geometry of the physical objects and processes being modeled.
What is CFD? Comparison&Analysis Fluid Mechanics Simulation Results Physics of Fluid Mathematics Computer Navier-Stokes Equations Computer Program Programming Language Numerical Methods Geometry Discretized Form Grids Fluid Problem C F D
Why use CFD? Simulation(CFD) Experiment Cost Cheap Expensive Time Short Long Scale Any Small/Middle Information All Measured Points Repeatable All Some Security Safe Some Dangerous
Where use CFD? Streamlines for workstation ventilation Chemical Processing • Chemical Processing • HVAC(Heat Ventilation Air Condition) • Hydraulics • Aerospace • Automotive • Biomedical • Power Generation • Sports • Marine reactor vessel - prediction of flow separation and residence time effects. Hydraulics HVAC
Where use CFD? Aerospace • Chemical Processing • HVAC • Hydraulics • Aerospace • Automotive • Biomedical • Power Generation • Sports • Marine Biomedicine Automotive Temperature and natural convection currents in the eye following laser heating.
Where use CFD? Sports Power Generation • Chemical Processing • HVAC • Hydraulics • Aerospace • Automotive • Biomedical • Power Generation • Sports • Marine Flow around cooling towers Marine
You are Here ↓ Introduction to CFD Data Centre Case Study – Geometrical Details CFD while designing of HVAC system CFD while installation of Data Centre CFD for maintenance of Data Centre – Feedforward System
Introduction to the Case Study • Case Study is taken from one of the project that we did for a Data Centre in India • The case study includes what we did for the client also extends it for what could have been done for the same project using CFD • There were two software applications used for the project : OpenSource CFD platform of OpenFoam and commercial CFD package of Fluent • Both packages produced about the same results, in this presentation the results from OpenFoam are being shown
Case Description • The analyzed Data Centre is rectangular with of area 516m2 and height 3.35mt • Cooling is to be provided using raised flooring layout and demarcation is done for Cold Aisle and Hot Aisle • The sources of heat gain inside the data centre are listed below: • Heat gain through exterior walls accounting for thermal resistance of the wall • Heat gain from Server Racks, 154 Server racks each providing about 8 KW combine to about 1.26 MW • Three fans of about 500CMH were assumed to transport air from cool aisle to hot aisle in each rack unit (Since detailed blade specification is not known)
HVAC System Specification • 10 CRAC units, 1 Standby Specification: • Each CRAC unit of 30,585 CMH • Cooling capacity of Each Rack is 150 KW • Temperature of supply air is 9.4 oC • Return Air opening area (On top surface): 2.23 m2 • Supply Air Diffuser (Cold Aisle) Specifications: • Dimension of 600mm X 600mm • 70% open area • 1 supply diffuser per rack (Total 154) • Supply air velocity can be controlled using under floor fan • Return Air Diffuser (Hot Aisle) Specification: • Dimension of 600mm X 600mm • 50% open area • Total no. of diffusers: 242
Objective of the Study • To maintain recommended temperature by ASHRAE for Class 1data centre • The recommended atmosphere is defined as: • Temperature of 20oC - 25oC • Relative humidity of 40% - 55 % • The allowed change in temperature should be less than 5oC/hr
Design Parameters • Number of CRAC’s • Location of CRAC’s • Velocity of supply air
You are Here ↓ Introduction to CFD Data Centre Case Study – Geometrical Details CFD while designing of HVAC system CFD while installation of Data Centre CFD for maintenance of Data Centre – Feedforward System
Base Case Design CRAC Units (11 Nos.) Return Diffusers Supply Diffusers False Ceiling False Flooring Server Racks Isometric View of the Designed Data Centre
Case Study Cont… COLD AISLE Diffusers HOT AISLE Diffusers CRAC Units (11 Nos.) Server Racks Top View of the Designed Data Centre
CFD Simulation of Base Case Temperatures across Y-Z plane
Temperature Contour Temperature Profile at vertical planes along the racks and cold aisle.
CFD Simulation of Base Case Temperatures across X-Y plane
Temperature Contour Temperature Profile at Horizontal planes along the racks and cold aisle. Lets look at the mid-plane contour in more detail…..
Temperature Contour in Middle Plane The temperature contour at the Horizontal plane at the middle portion of the rack
CFD Simulation of Base Case Temperatures across X-Z plane
Temperature Contour Temperature Profile at the middle plane is showing most uneven distribution. Lets analyse the middle plane in detail
Temperature Contour in Middle Plane The temperature contour at the vertical plane at the middle portion of the rack
Velocity Vectors in Middle Plane The Velocity Vectors at the vertical plane at the middle portion of the rack
Conclusion from the base case CFD • The Average temperature on the rack surface at the cold Aisle side is 15 • The temperature at Cold Aisle is varying from 12 to 17 • The Average temperature on the rack surface at the Hot Aisle side is 27 • The temperature at Hot Aisle is varying from 18 to 32 • The simulation shows that a good number of servers are experiencing temperature well above and below the ASHRAE recommended temperature levels • Short circuiting of cold air is clearly visible in the simulation
Optimizing number of CRAC units & Supply Air Velocity • Maximum heat load : 154 X 8 = 1264 KW (1.26 MW) • Heat capacity of each CRAC : 150 KW • Minimum number of CRAC required: [8.4] = 9 • The system was designed with 9 CRAC units and velocity of supply air was adjusted to avoid short circuiting and temperature stratification • In this case the velocity of 2.2 m/s is coming out to be higher • The simulation was conducted with velocity of 1.6, 1.7, 1.8, 1.9, 2.0 & 2.1 m/s • The results with 1.8 m/s showed best results
Temperature Distribution with 9 CRACs & 1.8 m/s The temperature contour at the vertical plane at the middle portion of the rack
Velocity Vectors with 9 CRACs & 1.8 m/s The Velocity Vector at the vertical plane at the middle portion of the rack
Results of improved design CFD • The Average temperature on the rack surface at the cold Aisle side is 16 • The temperature at Cold Aisle is varying from 13 to 17 • The Average temperature on the rack surface at the Hot Aisle side is 23 • The temperature at Hot Aisle is varying from 19 to 29 • Short circuiting of cold air is reduced to a substantial level, however still prevalent • The simulation shows that a most of the servers are experiencing temperature as recommended by ASHRAE
Conclusion • Using Computational Fluid Dynamics the system was designed to reduce to 90% of original design, thus bringing about first cost saving of 10% in the capital cost. • The new system uses less energy and produces better result than the initial design based on thumb rules
You are Here ↓ Introduction to CFD Data Centre Case Study – Geometrical Details CFD while designing of HVAC system CFD during installation of Data Centre CFD for maintenance of Data Centre – Feedforward System
Case Description • The capacity of this data centre of of 42 X 154 = 6,468 Server Blades • 4,000 server blades are to be installed • 1,000 servers are by Dell, 2,000 by IBM & 1000 by Sun • The design variables are: • Number of CRAC units • Which CRAC unit should be operational • Location of Server Blades in the racking system • Velocity of supply air inlet
CFD Simulation Setup • The power requirement of 3000 Server is minimum 713 KW – 5 CRAC (750KW) are minimum number of units which can provide the required tonnage • The CFD simulation were conducted with various locations of Servers, CRAC’s and Supply air velocity • The best result was found with following parameters: • Top Racks are empty • Alternative CRACs are operating • Velocity of Supply air is 1.2 m/s
CFD Simulation Results Server Positions in the Racks
CFD Simulation Results Operational CRAC’s
Temperature Distribution with 5 CRACs & 1.2 m/s The temperature contour at the vertical plane at the middle portion of the rack
Velocity Vectors in Middle Plane The Velocity Vectors at the vertical plane at the middle portion of the rack
Calibration during Installation Temperature Sensors • The Result from CFD shall be compared with average reading shown by temperature and velocity sensors • If there is any difference, the modeling shall be improved to arrive at the actual values.
You are Here ↓ Introduction to CFD Data Centre Case Study – Geometrical Details CFD while designing of HVAC system CFD during installation of Data Centre CFD for maintenance of Data Centre – Feedforward System
Feedforward System • Whenever capacity of the data centre is to be increased, the design parameters like number of CRACs and supply air velocity should be determined using CFD • If the capacity ramp up is not that frequent than CFD simulation can be conducted at that stage to arrive at design parameters • If ramp-up/ramp-down is very frequent then a custom made CFD code should be developed using OpenSource Libraries. This would enable data centre administrator to conduct CFD’s for his data centre and analyze various design options
Conclusion • CFD can help design and operate the data centre HVAC system with optimum efficiency Thank You