Download

1 / 14
150 likes | 368 Vues
KINE 601 “Statistical Significance” and Sampling Reading: Huck pp 99 - 232. Review of Sampling & Inference Concepts. Population: all members of a specified group Sample: a defined subset of the population Parameter: a numerical or nominal characteristic of a population

E N D
KINE 601 “Statistical Significance” and Sampling Reading: Huck pp 99 - 232
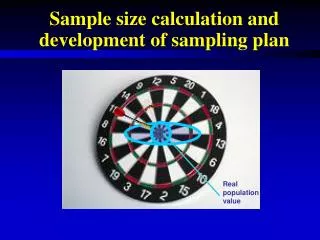
Review of Sampling & Inference Concepts • Population:all members of a specified group • Sample:a defined subset of the population • Parameter:a numerical or nominal characteristic of a population • Statistic:a numerical or nominal characteristic of a sample which represents the population parameter SAMPLE (statistics represent parameters) POPULATION (parameters of interest) Inference space "Generalizability"
Review of Types of Hypotheses • Hypothesis • speculation, educated guess • Research (Alternative) Hypothesis • proposed relationship between independent and dependent variables • hypothesis accepted as true if the null is rejected • Null Hypothesis • hypothesis for statistical testing • stated in negative form • "there will be no significant difference…." • "no relationship exists between…." • although true null hypotheses are seldom stated formally in the literature, they are always "implied" to exist • null hypotheses are used because: • test statistics require that “effects” are assumed to be nil • If the null is rejected, the alternative hypothesis is easy to interpret
Research Study Outcomes & Errors Truth in the Population treatment has no effect (Ho is true) treatment has an effect (Ho is false) incorrect conclusion correct conclusion effect is found to be present (reject Ho) probability (p) = a probability (p) = 1 -b Statistical “power” Conclusion Reached in the Study Type I error incorrect conclusion correct conclusion no effect found (accept Ho) probability (p) = b probability (p) = 1 - a Type II error • notes:1. a Type I error rate must be selected for each statistical comparison performed • - the more analyses you perform, r u chances of making a Type I error • 2. statistical power: the chance of finding an effect when an effect is indeed present
the Normal Distribution z = -2.58 z = +2.58 99% of scores z = -1.96 z = +1.96 95% of scores Z - scores 0 -3.0 -2.0 -1.0 +1.0 +2.0 +3.0 (standard deviations)
z-scores and a levels z = +1.65 ( a = .05 ) 95% of means distribution of post treatment means where HO is true HO is true but may be rejected anyway Z - scores 0 -3.0 -2.0 -1.0 +1.0 +2.0 +3.0 z = +2.33 ( a = .01 ) 99% of means distribution of post treatment means where HO is true HO is true but may rejected anyway Z - scores 0 -3.0 -2.0 -1.0 +1.0 +2.0 +3.0
H0-unknown distribution of means where no effect is present (null hypothesis) The Concept of Statistical Significance Ha-distribution of means where treatment effect is present (alternative or research hypothesis) x - dependent variable mean after treatment Statistical Power the probability of rejecting H0 when it is in fact false (finding an effect when one is indeed present) x H0 Ha 1 - b (power) 1 - a b a Z - score: 1.65 (95% of means in H0 distribution lie to the left, 5% to the right) corresponds to an a level of .05 note: as a gets smaller, 1-b also gets smaller
Types of Probability Samples • Simple Random Sample:all members of a population have an equal chance of being selected • selection of one element does not affect selection of another • Stratified Random Sample:taking asample from a sub-population in such a way that identified subgroups are represented • ensures that sample is truly representative of population • quota sample: stratification without randomization • sample must have X% of subjects with characteristic 1, Y% with characteristic 2… • Systematic Sample: taking every n'th element of a population • more complex formulae may be used for selection • Cluster Sample:random selection of groups or blocks that have a desirable trait or characteristic • example: randomly select 10 hospitals for employee Hepatitis B testing
Types of Non-Probability Samples • Convenience Sample:a sample consisting of a group or groups that are readily available to the researcher • examples: • standing in a mall and asking people to complete surveys • professor using his class members • serious inference limitations • Purposive Sample:selection based on on "inclusion criteria" • selecting subjects based on a characteristic, quality, or trait they possess • used often in human research • no attempt made at randomization r inference is limited • sometimes invalid inference claims are made in article conclusions • example: postmenopausal women taking hormones and exercising 3 days/wk • it is sometimes necessary to make extensive efforts to "recruit" subjects • recruiting methods should be described in detail in manuscript or presentation • snowballing: using current subjects to recruit new ones
Sampling Problems • Survey Response Rates: 60% - 80% required • Portney & Watkins 1993, Gay 1981 • Ways of addressing non-response bias: • follow up mailing(s) • acknowledgement in the manuscript • interview some of the non-respondents - compare results with respondents • Sampling Error • the difference between a parameter and its representative statistic • standard error (of the mean) - standard deviation of a group of sample means • may sometimes be given in conjunction with treatment resultant means instead of standard deviations • estimated by any sample standard deviation divided by square root of sample subject number s n
Sampling Problems • Sample Size:- how many subjects do you need ? • descriptive research - 10% - 20% of the population • correlational - causal comparative studies: = 30 subjects per experimental unit • tightly controlled experimental studies: =15 subjects per experimental unit • depends on: • desired statistical power - the larger the subject number, the greater the power • subject number is the most potent influence on statistical power • effect size (ES) - the extent or magnitude of the experimental effect • "raw" ES: posttest mean - pretest mean • more commonly, standardized ES's are used (raw ES / variability) • small ES = .2 medium ES = .5 large ES = .8 • the larger the anticipated effect size, the smaller the required sample number • significance criterion (a : the statistical probability of making a Type I Error) • the smaller the a level, the larger the required sample number • type of statistic used - complex designs and statistics necessitate larger samples • more than one independent and / or dependent variables r larger samples • inadequate sample size adversely affects both internal & external validity
Population Estimates taken from Samples • sample mean ( y ) is a point estimate of population mean ( m ) • interval estimates formcan be obtained using confidence intervals • CI: y+ za/2 (standard error) • example: construct a 95% confidence interval for the population mean (m) when the sample yields: y = 379.2, n = 36, s = 124. • since we desire a 95% CI,a= .05 and a / 2 = .025 rz.025 = 1.96 • standard error = s / n = 20.7 • CI = 379.2 + 1.96 (20.7) = 379.2 + 40.6 • 95% of the confidence intervals constructed like this will contain actual m • confidence intervals are used to estimate numerous kinds of parameters
Hypothesis testing • Steps in hypothesis testing • State the null hypothesis to be tested • H0: no "difference" or "relationship" exists • State the alternative (research) hypothesis • Ha: usually the simple alternative that a difference or relationship does indeed exists • some studies specify the direction of the difference (one vs. two "tailed" tests) • if you are "sure" of the direction, you can increase your statistical power • Select a level of significance • "comparisonwise" vs "experimentwise" error rates • dividing up the a (Bonferroni technique) • Determine sample size (statistical power), collect and summarize data • Perform a statistical analyses (refer to a decision making criterion) • obtain a "calculated value" of a statistic and compare to "critical value" • reject H0 if "calculated value" is > "critical value" • obtain "p value" (probability value) and compare it with a level • obtain a measure of relationship or strength of association • Accept or reject the null hypothesis • Evaluate "statistical" significance versus "practical" significance
Interpreting "p-values" & "Degree of Significance" • p-values - the exact probability of a type I error ( a ) • the "margin" by which H0was rejected or accepted • results of statistical analyses are usually presented in one of two ways: • 1. p > a or p < a • " a significant difference was found to exist between groups ( p < .05 ) " • " the correlation coefficient was not statistically significant ( p> .05 ) " • 2. the exact a value is given as p = .xxxxx • " significant differences were found between groups X and Y ( p = .0128 ) and between groups A and B ( p = .003 ) " • the p value does not indicate ES or the degree of difference between H0 and Ha • indicates only the degree to which difference could have occurred by chance • the term " highly significant " appears often in the literature implying that the independent variable made a huge difference in dependent variable scores when, in fact, this may not be the case • remember, an inverse relationship exists between sample size and p-value • with a large sample, the p-value can be very low, even when ES is small • larger sample r smaller treatment variance r more power • some authors report results that are "borderline" significant ( p = .053 )