Download
1 / 78
780 likes | 948 Vues
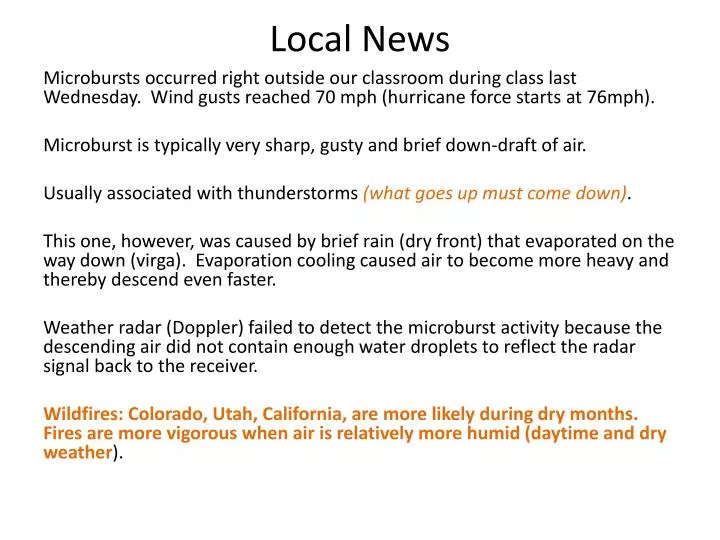
Local News. Microbursts occurred right outside our classroom during class last Wednesday. Wind gusts reached 70 mph (hurricane force starts at 76mph). Microburst is typically very sharp, gusty and brief down-draft of air. Usually associated with thunderstorms (what goes up must come down) .

E N D
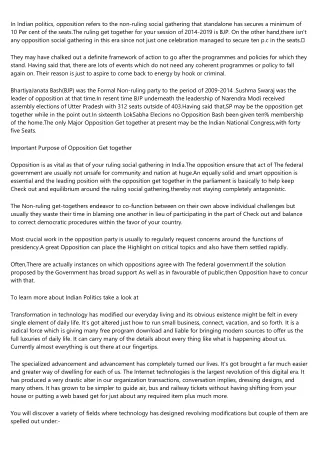
Local News Microbursts occurred right outside our classroom during class last Wednesday. Wind gusts reached 70 mph (hurricane force starts at 76mph). Microburst is typically very sharp, gusty and brief down-draft of air. Usually associated with thunderstorms (what goes up must come down). This one, however, was caused by brief rain (dry front) that evaporated on the way down (virga). Evaporation cooling caused air to become more heavy and thereby descend even faster. Weather radar (Doppler) failed to detect the microburst activity because the descending air did not contain enough water droplets to reflect the radar signal back to the receiver. Wildfires: Colorado, Utah, California, are more likely during dry months. Fires are more vigorous when air is relatively more humid (daytime and dry weather).
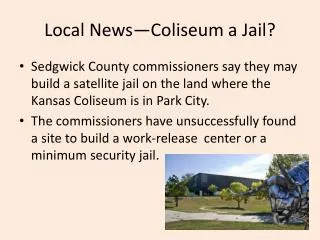
Neola Wildfire – 2007Katie Source: www.telegraph.co.uk
U.S. Weather-Related Deaths(1988-2007 - textbook, page 6) • Tornadoes – 54 • Hurricanes – 66 • Lightning – 53 • floods – 81 (rip currents = 200 dead)
Utah Climograph Rainy season is cooler as well as more humid Dry season feeds and rewards fires
MeteorologyAtmosphere and Sky Lithosphere (geosphere – rocks) Hydrosphere Atmosphere Biosphere Our subject is the atmosphere, but hydro “water” is a KEY element in the atmosphere.
Meteorology Atmosphere and Sky Wind Pressure Temperature Cloudiness (condensation) Humidity Precipitation
Outlook -- generalized climate-based view of history, like “Poor Richard’s Almanac”Forecast – general outlook – trends, spoken as probability or ranges of time and place(statistics or chances – percentages)Prediction – is more about date, time, place and magnitude of the event (the Earth will end midnight on December 21, 2012)Planning-- Learning from the past, anticipating hazards and preparing for them (WFRC emergency prep plan, and annual “Shake Out” events)
Scientific Inquiry • Observation • Recognition of patterns • Hunch about the future • More focused observation & better tools • Hypothesis testing – a proposal that we test by experiment. We use statistical tests to ask: “What are the chances that this is just a coincidence?” • We use test results to organize more observation. • Eventually we adopt a working theory(very little in this world reaches the level of law, proof or axiom) • For some, we create paradigms -- reliable conclusions that we use for operations: design, construction, investment.
Theories are powerful A “paradigm” is a theory with special status because of its power to explain things. Much of what we do in this world is not based on proofs, but only paradigm theories that just keep working for us, even though we may never get to see what’s really inside.
Observations • Ground instruments • Ground to sky • Balloons – with radiosondes • Airplanes • Non-orbit rockets • Satellites
Trends Weather and climate are always changing – data for recent decades suggest yet another warming trend -- more warmth, more dryness – more drought. World average annual temperatures started rising behavior humans played a significant role. With the industrial age, our likely effect now is that we are adding further warmth, mostly by burning fossil fuels.
EarthCircleSphereSpheroidOblate SpheroidLumpy, Oblate Spheroid
Earth- atmosphere is only 100 miles thick - dry crust is only 5 to 50 miles thick (molten below)- both are moving convectively
Tectonic Forces and Terrestrial Heat Solar energy and Earth internal energy are both produced by radioactivity – decay of heavy, unstable atoms into stable atoms: uranium gradually turns into lead. Heat from radioactive earth produces convective flow, like a simmering pot on the stove. The same is true of the atmosphere - convective circulation.
Source: commons.wikimedia.org – Earth-lighting-summer-solstice EN.png
Earth Dimensions • Diameter = D – distance through the middle • Circumference = C – distance around the circle • Pi = π = a standard, fixed, constant relationship between C and D D = 7,923 miles -- about 8,000 miles C = 24,900 miles -- about 24,000 miles π = 3.1415868. . . -- about 3.0
So . . . . C = π x D 24 = 3 x 8 D = C / π 8 = 24/3 π = C / D 3 = 24/8 24 hours in a day – 24 time zones 360 degrees in a circle – 15 degrees per time zone. The Earth turns 15 degrees per hour. At the equator, each time zone spans 1,000 miles.
Earth curves down at three feet per mile Source: Wikipedia.org/wiki/Figure_of_the_Earth
Earth coordinatesLatitude & Longitude Source: worldwind.arc.nasa.gov
Geographic Coordinates Latitude (like a ladder) – lines going east-west that measure north/south Longitude (long lines) that go from pole to pole, measuring distances or time east/west.
Euclidean or flat cartesian grid applied to a sphere: - lines of latitude vary in length; - lines of longitude are curved; a compromise.
Climate is the sum of all weather across time. Climate cannot predict the weather. World average annual temperature: 59°F Lima, Ohio, annual average temperature: 59°F Lima, Peru, annual average temperature: 59°F
Climograph Source: shannonmapcatalog.blogspot.com
Weather Variability Without atmosphere: • Earth temperature would be +5° degrees F, instead of 59°F; • Temperature would vary by hundreds of degrees, rather than by just tens of degrees: .
Contents of the Atmosphere Permanent gases N2 = 79% O2 = 21% O3 = ozone Ch4 = methane CO = carbon monoxide CO2 = carbon monoxide (rising from 280 pm to about 400 ppm PM = particulate matter (PM2.5, PM10) H2O = water vapor (1-4 percent by volume) Oxides of Nitrogen and Sulfur (and others) Ch4 Variable gases
Atomic Weights Hydrogen = 1 Carbon = 12 Nitrogen = 14 Oxygen = 16 Sulfur = 32 So . . . . What are the weights of atmospheric molecules? O3 = ozone Ch4 = methane (much more powerful GHG than carbon dioxide) CO = carbon monoxide (poison) CO2 = carbon monoxide (rising from 280 pm to about 400 ppm PM = particulate matter (PM2.5, PM10) H2O = water vapor
N2O Source: Globalwarmingweb.com
Solar heating is indirect, by absorption, conversion and re-radiationAtmospheric gases are mostly transparent to solar photons (short amplitude) except for . . . . . ?
Review the “Ozone” story Atmospheric ozone (made naturally by interaction of oxygen with in-coming solar Uv (ultraviolet) solar energy. Ground-level ozonecreated by lightning, ocean waves and a host of human processes (cars and industrial activity). Chlorofluorocarbons and other man-made chemicals break down ozone, preventing ozone from blocking Uv.
Ground-Level Ozone and Smog Anthropogenic oxides of nitrogen and sulfur (industry and automobiles) interact with sunlight to produce more ground-level ozone.
Atmospheric carbon dioxide seasonal adjustment and gradual base increase
Most land mass is in the northern hemisphere, so most plant growth and CO2 absorption during March to October.
Atmospheric warmth budget Of every 100 photons of solar energy received: • 31 are reflected back into space (no effect) • 69 are absorbed, converting to thermal energy (heat): • 45 go into earth and water • 24 go into the atmosphere (3 alone go into ozone layer) More than 99.9 are re-radiated back into outer space. Global warming (?) and HC storage are exceptions.
Energy Transfer Radiation from outer space travels across empty space. The portion that is notreflected back out is absorbed, converting to thermal (infrared), energy transfers by: • Convection • Conduction • Re-radiation Mostly short wave radiation IN, mostly long wave radiation going back OUT. (automobile windshield example)
British Thermal Unit - Btu Energy needed to raise the temperature of one gram of water 1 degree F.
Role of Dust and Clouds is Mixed • Aerosols and condensation (opacity) reflect incoming radiation (mostly short wave). • They also help keep longer wave radiation from escaping back to space. • So, solids and visible liquids in the atmosphere act as a ‘blanket’, keeping energy out, and keeping it in. • Cloudy weather will be cooler during the day and warmer at night with the ‘blanket’ effect. • The same effect results from being downwind from a large water body.
Allred’s Three Climate RulesLand mass heats and cools more quickly than water Distance from: • Large water body • Sea level • Equator • Downwind? • Annual and daily temperature range for Singapore and Buffalo, NY (east side of northern continent) and Tooele.
Thermal Structure of the Atmosphere Troposphere – lowest region, a mixing zone (6 miles) Where storminess and surface heating occur – convection and circulation, aerosols and water vapor. Temperature generally drops with altitude. Stratosphere – ‘layered’ region, including the ozone layer. Rising temperature with altitude due to ozone (30 miles). Mesosphere - cooling with height, very thin air, virtually no air pressure, includes the coldest part of the atmosphere (50 miles). Thermosphere – virtually no air, but extreme heating of solid objects, caused by being first line of contact with incoming radiation.
General Environmental Lapse Rate Most atmospheric heating occurs near absorbing surfaces (water, dirt and thicker atmospheric layers near the surface of the Earth) Air temperature generally declines by 3-5°F per 1,000 feet of increasing altitude. Use 3.0°F for extreme wet air and 5.0°F for extreme dry air.
Electromagnetic Spectrum Higher energy level Lower energy level