Download
1 / 21
240 likes | 382 Vues
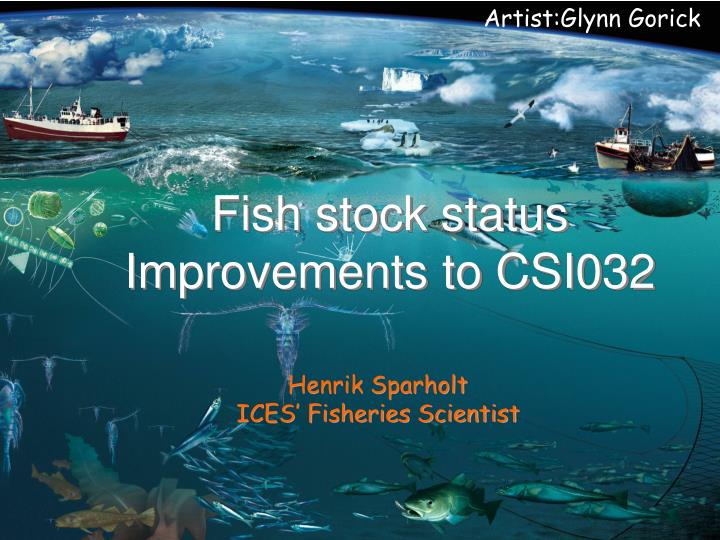
Artist:Glynn Gorick. Fish stock status Improvements to CSI032. Henrik Sparholt ICES’ Fisheries Scientist. Why do we have this indicator?. Northeast Atlantic Commercial catch. Why do we have this indicator?.

E N D
Artist:Glynn Gorick Fish stock statusImprovements to CSI032 Henrik Sparholt ICES’ Fisheries Scientist
Why do we have this indicator? • Fish stocks around the world are under high fishing pressure. Some are not used in a sustainable way. • We want an indicator to tell us to what extent stocks are overexploited by area
Two sub-indicators • Proportion of catches that are routinely assessed by scientists • Proportions of the stocks assessed that are within or outside safe biological limits (SBL).
The criteria used to judge whether stocks are outside SBL are fishing pressure, often expressed in terms of fishing mortality, and the spawning stocks size • Both of these are related to biological reference points defined by scientists and based on United Nations’ guidelines for good fisheries management including the precautionary approach and the ecosystem approach .
Cod Baltic Sea Reference points
Ongoing monitoring • ICES, ICCAT and GFCM and member countries spend annually 0.1 billion Euro monitoring fish stocks • Annual catch worth 10 billion Euro We use this database for the CSI32 indicator
What kind of monitoring • Complete catch statistics since 1903 by fish species • Each year age composition, growth, maturity determined on millions of fish • Research vessels surveys, bottom trawl, acoustic, TV camera • Logbook data – commercial vessels since 1990
Problem! • What is a commercial stock – which one should be included and which one excluded? • Should it be those contributing 0.01%, 0.1%, 1% to the catch, in value or weight, etc etc.??? • Difficult to keep consistent by area and time -- therefore not a good indiator
Future Quick wins (2007/2008)
Future Short term goals (2008/2009)
Work with FAO and EU to improve data collection in the Black Sea and Mediterranean Sea • Delevop metrics about stock collapse • Develop time series of scientific advice, TACs and actual catch
Future Long term goals (2009/2010)
Further develop stock status indicators. ICES ACOM will work on this for their own sake and it would be useful to consider what they find out • Re-examination of the indicator in relation to upcoming Maritime Policy of various aspects: MPAs, bycatches, CO2 emmission etc.