Download
1 / 24
350 likes | 837 Vues
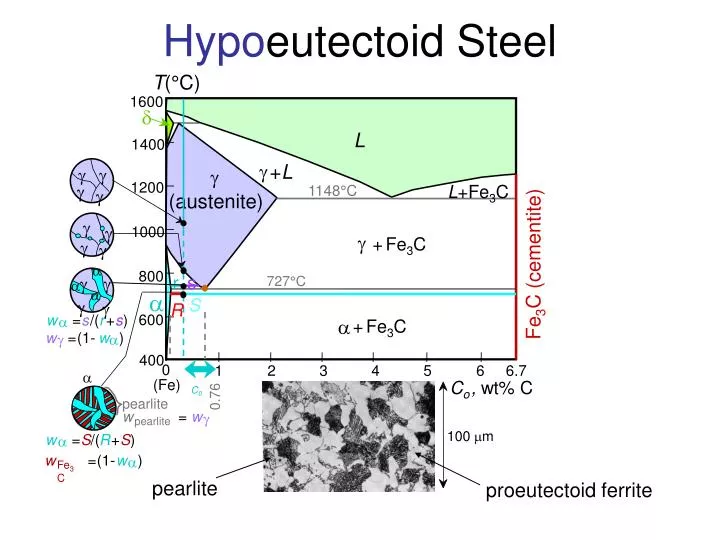
T (°C). 1600. d. L. 1400. g. + L. g. g. g. 1200. L +Fe 3 C. 1148°C. (austenite). g. g. g. 1000. g. g. + Fe 3 C. g. g. Fe 3 C (cementite). r. s. 800. a. g. g. 727°C. a. a. a. g. g. R. S. 600. a. + Fe 3 C. w. =. s. /(. r. +. s. ). a. w. =. (1-. w.

E N D
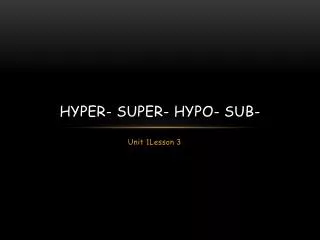
T(°C) 1600 d L 1400 g +L g g g 1200 L+Fe3C 1148°C (austenite) g g g 1000 g g +Fe3C g g Fe3C (cementite) r s 800 a g g 727°C a a a g g R S 600 a +Fe3C w = s /( r + s ) a w = (1- w ) g a 400 0 1 2 3 4 5 6 6.7 a Co, wt% C (Fe) C0 0.76 pearlite w = w g pearlite 100 mm w = S /( R + S ) a w = (1- w ) a Fe3C pearlite proeutectoid ferrite Hypoeutectoid Steel
Proeuctectoid Ferrite – Pearlite 0.38 wt% C: Plain Carbon – Medium Carbon Steel
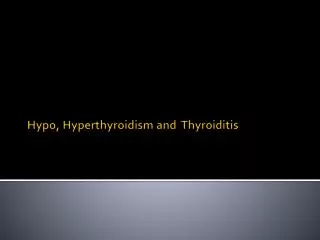
T(°C) 1600 d L 1400 g +L g g g 1200 L+Fe3C 1148°C g g (austenite) g 1000 g g +Fe3C g g Fe3C (cementite) Fe3C s r 800 g g a g g R S 600 a +Fe3C w = r /( r + s ) Fe3C w =(1- w ) g Fe3C 400 0 1 2 3 4 5 6 6.7 Co, wt%C (Fe) pearlite w = w g pearlite w = S /( R + S ) a 60mm w = (1- w ) a Fe3C pearlite proeutectoid Fe3C Adapted from Fig. 9.33,Callister 7e. Hypereutectoid Steel Co 0.76
Proeutectoid Cementite - Pearlite 1.4 wt% C: Plain Carbon – High Carbon Steel
Phase Transformations • We just studied Phase Diagrams which are thermodynamic maps which tell us the equilibrium phases present at any specific combination of temperature, pressure, and composition • These phase diagrams are based on the concept of Gibbs Free Energy, DG, which we have briefly introduced before: • DG is the thermodynamic driving force for a reaction • If DG is negative then there is a probability that a reaction will occur. • The more negative DG becomes, the more driving force there is for the reaction • Thermodynamics tells us the probability of a reaction but not the rate – the rate of a reaction is determined by Kinetics Now we are going to shift perspectives and discuss the details of how we transform from one phase to another
Phase Transformations Phase transformations involve some form of change in the microstructure Let’s categorize with 3 types: • Simple diffusion-dependent transformations in which there is no change in the number or composition of the phases present Examples: • Solidification of a pure metal • Allotropic transformations • Recrystallization and Grain Growth • Diffusion-dependent transformations in which there is a change in the phase compositions and or number of phases present Examples: • Eutectoid reaction • Peritectic reaction • Diffusion-less transformations, in which a metastable phase is produced Examples: • Martensitic and Bainitic transformations
Nucleation During Phase transformation – new phase formed with different physical/ chemical characteristics than the parent phase Diffusion based Phase Transformations do not occur instantaneously – nucleated • nuclei (seeds) act as template to grow crystals • for nucleus to form, rate of addition of atoms to nucleus must be faster than rate of loss • once nucleated, grow until reach equilibrium Driving force to nucleate increases as we increase T • supercooling (eutectic, eutectoid reactions) Small supercooling few nuclei - large crystals Large supercooling rapid nucleation - many nuclei, small crystals
Solidification: Nucleation Processes • Homogeneous nucleation • nuclei form in the bulk of liquid metal • requires supercooling (typically 80-300°C max) • Heterogeneous nucleation • much easier since stable “nucleus” is already present • Could be wall of mold or impurities in the liquid phase • allows solidification with only 0.1-10ºC supercooling
Consider Solidification First Let’s assume spherical nuclei Why? Sphere has the smallest surface area/ surface energy for a given volume Let’s Determine the equations that define behavior
Surface Free Energy-destabilizes the nuclei (it takes energy to make an interface) g = surface tension Homogeneous Nucleation & Energy Effects Surface area of sphere DGT = Total Free Energy = DGS + DGV Volume (Bulk) Free Energy – stabilizes the nuclei (releases energy) embryo nucleus DGn = free energy difference between the parent and daughter phase r* = critical nucleus: nuclei < r* shrink; nuclei>r* grow (to reduce energy)
r* = critical radius g = surface free energy Tm = melting temperature HS = latent heat of solidification DT = Tm - T = supercooling r* decreases asT increases For typicalTr* ca. 100Å Solidification • Note:HS = strong function of T T1 > T2 =weak function ofT
Other Effects of Temperature Maximum Nucleation Rate occurs at intercept of two curves Clustering of atoms by short range diffusion – Diffusivity has Arrhenius behavior Number of stable nuclei follows Arrhenius behavior (like vacancy densities)
Heterogenous Nucleation Young’s Law:
Heterogeneous Nucleation Note: DG*het = DGhom S(q)
Heterogeneous vs Homogenous DG*het = DGhom S(q) • Lower activation energy barrier • Less undercooling required • Faster transformation rate
Nucleation vs Growth Rates • Growth is determined by long range diffusion • Arrhenius activation energy behavior Overall transformation is equal to the product of Ġ and Ń Rate = 1/time
Kinetics of Phase Transformation • Discussed Thermodynamic driving forces in detail • Kinetics – measures the approach to equilibrium vs. time • Hold temperature constant & measure conversion vs. time
All out of material - done maximum rate reached – now amount unconverted decreases so rate slows rate increases as surface area increases & nuclei grow By convention r = 1 / t0.5 Rate of Phase Transformation Fixed T Avrami rate equation => y = 1- exp (-ktn) • k & n fit for specific sample Fraction transformed, y 0.5 t0.5 log t time fraction transformed
135C 119C 113C 102C 88C 43C 1 10 102 104 Rate of Phase Transformations • In general, rate increases as T r = 1/t0.5 = A e -Q/RT • R = gas constant • T = temperature (K) • A = pre-exponential factor • Q = activation energy Arrhenius expression • r often small: equilibrium not possible!
• Growth of pearlite from austenite: Diffusive flow of C needed Austenite (g) cementite (Fe3C) grain a Ferrite (a) a a boundary g g a g g a pearlite a Adapted from Fig. 9.15, Callister 7e. a growth a direction a • Transformation rate increases with DT. 100 600°C (DT larger) 650°C 50 y (% pearlite) 675°C (DT smaller) 0 Eutectoid Transformation Rate Course pearlite formed at higher T - softer Fine pearlite formed at low T - harder
Nucleation and Growth 100 Nucleation rate increases with T % Pearlite Growth Growth rate increases with T regime 50 Nucleation regime t log(time) 0.5 0 pearlite colony g g g T just below TE T moderately below TE T way below TE Nucleation rate low . Nucleation rate med Nucleation rate high Growth rate high Growth rate med. Growth rate low Reaction rate is a result of nucleation andgrowth of crystals. • Examples:
1600 T(°C) d L 1400 g +L g 1200 L+Fe3C 1148°C (austenite) 1000 g +Fe3C a Eutectoid: Fe3C (cementite) ferrite Equil. Cooling: Ttransf. = 727ºC 800 727°C DT a +Fe3C 600 Undercooling by DTtransf. < 727C 0.022 0.76 400 0 1 2 3 4 5 6 6.7 Co, wt%C (Fe) Consider Eutectoid Transformation … Eutectoid transformation (Fe-C): g Þ a + Fe3C 0.76 wt% C 6.7 wt% C 0.022 wt% C
Isothermal Transformation Diagrams T(°C) Austenite (stable) TE(727C) 700 Austenite (unstable) Pearlite 600 isothermal transformation at 675°C 500 100% 50% 0%pearlite 400 time (s) 2 3 4 5 1 10 10 10 10 10 • Fe-C system, Co = 0.76 wt% C • Transformation at T = 675°C. 100 T = 675°C y, % transformed 50 0 2 4 time (s) 1 10 10
Effect of Cooling History in Fe-C System 2 3 4 5 1 10 10 10 10 10 T(°C) Austenite (stable) TE (727C) 700 Austenite (unstable) Pearlite 600 g g g g g g 100% 500 50% 0%pearlite 400 time (s) • Eutectoid composition, Co = 0.76 wt% C • Begin at T > 727°C • Rapidly cool to 625°C and hold isothermally.