Download
1 / 119
1.19k likes | 1.19k Vues
Explore the dynamics of energy flow and chemical cycling in ecosystems, including the roles of autotrophs, heterotrophs, and decomposers. Learn about trophic relationships and the efficient transfer of energy between trophic levels.

E N D
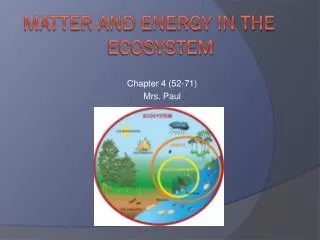
Ecosystems, Energy, and Matter • An ecosystem consists of all the organisms living in a community
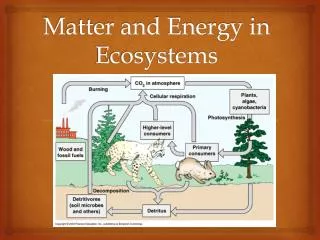
Regardless of an ecosystem’s size, its dynamics involve two main processes: energy flow and chemical cycling
Ecosystems and Physical Laws • The laws of physics and chemistry apply to ecosystems particularly in regard to the flow of energy • Second law of thermodynamics- a proportion of energy is lost as heat during energy transfers
Organisms are either autotrophic or heterotrophic Organisms need nutrients for growth and reproduction • Heterotrophic-obtain carbon compounds from other organisms by feeding on them • Mixotrophic-not excusively autotrophic or heterotrophic (euglena)
Trophic Relationships • Energy and nutrients pass from primary producers (autotrophs) to primary consumers (herbivores) and then to secondary consumers (carnivores) • Plants are the main producers on land, while in water, photosynthetic protists and cyanobacteria (phytoplankton, algae) are the main producers
- A small number (1%) of plants and algae are parasitic, obtaining carbon compounds from other plants and causing them harm
The ultimate source of energy for most ecosystems is the sun
Consumers are heterotrophs that feed on living organisms by ingestion • Heterotrophs can be divided into groups based on their source of organic molecules and their method of obtaining them • Consumers feed off other organisms • Consumers sometimes divided into trophic groups according to who they consume
All other trophic levels are made of consumers or heterotrophs, which eat other organisms • Primary consumers eat plants or other producers, so are herbivores • Secondary consumers eat primary consumers, and are carnivores • Quaternary consumers eat tertiary consumers
Energy flows through an ecosystem • Entering as light and exiting as heat
Decomposition • Decomposition is the breakdown of organic material into inorganic matter, and connects all trophic levels • Most organic matter becomesdetritus-dead material produced at all trophic levels
Detritivores are heterotrophs that obtain organic nutrients from detritus by internal digestion • Saprotrophs are heterotrophs that obtain organic nutrients from dead organic matter by external digestion • Secrete digestive enzymes into dead organic matter and digest it externally and absorb products (bacteria, fungi)
Decomposers • Saprotrophs are special heterotrophs that recycle essential chemical elements by decomposing organic material and returning elements to inorganic reservoirs
Some energy moves through ecosystems as waste or excretion • Decomposers also release energy remaining in detritus (undigested food in wastes, and dead organisms)
The Global Energy Budget • The amount of solar radiation reaching the surface of the Earth limits the photosynthetic output of ecosystems • Most is absorbed, scattered, or reflected by the atmosphere or by the earth’s surface • Of all the visible light that reaches leaves and other autotrophs,only ~1.2% is converted to chemical energy by photosynthesis • This 1.2% on a global scale produces 170 billion tons of organic material (biomass)per year in the biosphere
Typically, only about 5-20% of the sun’s energy trapped by plants during photosynthesis is transferred to the primary consumers that eat plants • Respiration breaks down glucose made during photosynthesis and releases energy, this energy is lost as heat or used for maintenance by plants (growth, repair, reproduction) • This results in an 80-95% loss of energy from the chemical energy produced during photosynthesis
Biomass and Energy • Biomass is the total mass of organic matter such as carbohydrates, lipids, and proteins • Biomass is measured as the dry weight of organic matter found in living things • Dry weight (mass) is is the weight of the organic matter minus the weight of the water in that matter, since water is inorganic and does not contain usable energy • Biomass can be used as a measure of the amount of energy available in an ecosystem
Gross and Net Primary Production • Primary productivity is the rate at which producers convert solar energy to chemical energy • Total primary production in an ecosystem is known as that ecosystem’s gross primary production (GPP) • Gross production = total amount of energy trapped in the organic matter produced by plants/per area/per time
Net primary production (NPP) is equal to gross production minus the energy used by the primary producers for respiration
Different ecosystems vary considerably in their net primary production • And in their contribution to the total NPP on Earth
Energy transfer between trophic levels is usually about 10% efficient • The 90% decline is an average, this ranges from ~95% to 80% • The trend of energy flow declining significantly with each higher trophic level holds for all ecosystems
All energy transformations involve the conversion of some energy to heat, which is lost from the ecosystem • In most ecosystems, herbivores manage to eat only a fraction of the plant material produced, they also don’t digest all of what they consume • Herbivores may digest and absorb only about half of what it eats
Of the material that does get absorbed, about two-thirds is used as fuel for cellular respiration • Cellular respiration breaks down organic compounds to inorganic wastes and heat • Of all the energy taken in, only the chemical energy left over and stored after respiration can add to the biomass of the trophic level
Production Efficiency • When a caterpillar feeds on a plant leaf only about one-sixth (16%) of the energy in the leaf is used for secondary production
Most food chains are limited to 3-5 trophic levels, because there is not enough energy at the top level to support another trophic level
At each trophic level energy is lost as metabolic heat during maintenance (respiration) • The energy passed to the next trophic level becomes wastes, metabolic heat or is passed to the next trophic level • Eventually, all energy flowing through ecosystems is lost as metabolic heat
Pyramids of energy • This loss of energy with each transfer in a food chain can be represented by a pyramid of energy
Pyramids of Biomass • One important ecological consequence of low trophic efficiencies can be represented in a biomass pyramid • During respiration, glucose is broken down into water and carbon dioxide which is released back into the environment, resulting in a loss of biomass
Most biomass pyramids • Show a sharp decrease at successively higher trophic levels
Certain aquatic ecosystems • Have inverted biomass pyramids
Pyramids of Numbers • A pyramid of numbers represents the number of individual organisms in each trophic level
The dynamics of energy flow through ecosystems have important implications for the human population
Worldwide agriculture could successfully feed many more people if humans all fed more efficiently, eating only plant material
Humans have about 10X more energy available to them when they eat grain, than when they eat grain-fed cattle • It may actually take 100X more energy to feed humans on cattle, than on plants directly
Energy Flow • Every use of energy by an organism involves a loss of some energy in the form of heat • Eventually the ecosystem would run out of energy if not supplied by a continuous inflow of energy from an outside source like the sun
Nutrient or chemical cycling • Organisms absorb elements they require as inorganic nutrients from the abiotic environment, use them and return them to the environment with the atoms unchanged • Ecosystems have the potential to be sustainable over long periods of time • Requirements for sustainability: nutrient availability, detoxification of waste products, energy availabilty
Chemical Cycling • Chemicals are cycled between abiotic components (air, soil, water) and biotic components of the ecosystem • There are no extraterrestrial sources of water or other chemical nutrients, therefore life depends on the recycling of chemicals
Biological and geochemical processes move nutrients between organic and inorganic parts of the ecosystem • Nutrient circuits that cycle matter through an ecosystem involve both biotic and abiotic components and are often called biogeochemical cycles
A general model of nutrient cycling • Includes the main reservoirs of elements and the processes that transfer elements between reservoirs
Water Cycle • Water moves in a global cycle driven by solar energy • Three processes occur in the water cycle: 1.evaporation 2.precipitation 3.transpiration
Phosphorus Cycle • Rocks (Phosphorite) are main abiotic reservoir • Weathering/Erosion adds phosphate to soil • Plants use phosphate ions in soil to build organic compounds • Decomposition returns phosphates to soil • Some phosphates precipitate out of solution at bottom of lakes and oceans and become part of new rocks
Phosphorus Cycle • Turnover rate refers to the amount of phosphorus released from one stock to another per unit time. Phosphate is only slowly released to ecosystems by weathering and so has a slow turnover rate compared to nitrogen • Phosphorus can be added to the cycle by application of fertilizer or removed by the harvesting of crops
Phosphorus Cycle • Waterlogging of soils in poorly drained irrigated crops can dissolve phosphate and bring it into solution. Runoff containing phosphate from fertilizer can contribute to fresh water eutrophication • Peak phosphorus is the point in time at which the maximum global phosphate production rate is reached and then begins to fall because of the depletion of reserves
Data suggest that peak phosphorus is approaching and the problem will become acute within 50-100 yrs • Without fertilizer, famine would occur because crop yields would plummet without the addition of fertilizers. There are no alternate sources of phosphate and no synthetic way of making it
Nitrogen Cycle • Most of the nitrogen cycling in natural ecosystems involves local cycles between organisms and soil or water • Atmosphere is 80% nitrogen (N2 gas) • Plants can use nitrogen only in the form of nitrate (NO3-) or ammonium (NH4+)
Four main processes occur in the nitrogen cycle • Nitrogen fixation • Bacteria in the soil or in root nodules of legumes convert atmospheric N2 to ammonia (NH3) which becomes NH4+ • Nitrification • Bacteria convert NH4+ into NO3- which is the main source of nitrogen for plants
Ammonification • Detritivores decompose nitrogen-containing detritus back into ammonium • Denitrification • Soil nitrates are converted back into atmospheric N2 gas by bacteria
Decomposition and Nutrient Cycling Rates • Decomposers (detritivores) play a key role • In the general pattern of chemical cycling
The rates at which nutrients cycle in different ecosystems • Are extremely variable, mostly as a result of differences in rates of decomposition