Download
1 / 16
160 likes | 258 Vues
West Midlands Key Health Data 2011/12. Launch Event Monday 18 March 2013 12.30pm – 3.30pm Michael Tippett Room, Staff House University of Birmingham. Chapter 7 Measuring inequalities in small area life expectancy. Chapter contributions from: West Midlands Cancer Intelligence Unit

E N D
West Midlands Key Health Data 2011/12 Launch Event Monday 18 March 2013 12.30pm – 3.30pm Michael Tippett Room, Staff House University of Birmingham Chapter 7 Measuring inequalities in small area life expectancy Chapter contributions from: West Midlands Cancer Intelligence Unit Health Protection Agency West Midlands The Perinatal Institute NHS Warwickshire Warwickshire County Council Staffordshire County Council / NHS Staffordshire and NHS Stoke-on-Trent Heart of England Foundation Trust West Midlands Commissioning Support Unit
West Midlands Key Health Data 2011/12 Measuring inequalities in small area life expectancy Chapter 7 Measuring inequalities in small area life expectancy Daniel Eayres, Jane Fletcher, WMCSUPaul Kingswell, NHS Warwickshire
Longstanding and widely used measure of overall health outcome • Quantifies mortality risksin a readily understandable metric • Used in previous PSA target to reduce health inequalities between LAs • Public Health Outcomes Framework – Overarching outcomes • increased healthy life expectancy, i.e. taking account of the health quality as well as the length of life; • reduced differences in life expectancy and healthy life expectancy between communities (through greater improvements in more disadvantaged communities). Why measure life expectancy? West Midlands Key Health Data 2011/12 Chapter 7 Measuring inequalities in small area lifeexpectancyDaniel Eayres, Jane Fletcher, WMCSU; Paul Kingswell, NHS Warks
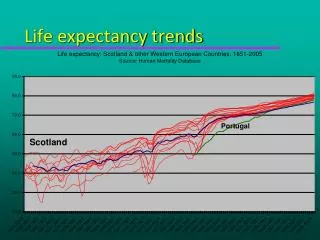
Male life expectancy at birth by region, England 2008-10 Life expectancy in the West Midlands Source: Compendium of Population Health Indicators, NHS Information Centre. West Midlands Key Health Data 2011/12 Chapter 7 Measuring inequalities in small area lifeexpectancyDaniel Eayres, Jane Fletcher, WMCSU; Paul Kingswell, NHS Warks
Female life expectancy at birth, England and the West Midlands 1991-93 to 2008-10 Life expectancy in the West Midlands Chapter 7 Measuring inequalities in small area life expectancy Source: Compendium of Population Health Indicators, NHS Information Centre. West Midlands Key Health Data 2011/12 Chapter 7 Measuring inequalities in small area lifeexpectancyDaniel Eayres, Jane Fletcher, WMCSU; Paul Kingswell, NHS Warks
Life expectancy at birth by local authority, West Midlands 2008-10 Males Females Life expectancy by local authority West Midlands Key Health Data 2011/12 Chapter 7 Measuring inequalities in small area lifeexpectancyDaniel Eayres, Jane Fletcher, WMCSU; Paul Kingswell, NHS Warks
Male life expectancy at birth vs. Deprivation by local authority, West Midlands 2008-10 Life expectancy by local authority Chapter 7 Measuring inequalities in small area life expectancy Source: Compendium of Population Health Indicators, NHS Information Centre; Indices of Deprivation 2010, Department for Communities and Local Government. West Midlands Key Health Data 2011/12 Chapter 7 Measuring inequalities in small area lifeexpectancyDaniel Eayres, Jane Fletcher, WMCSU; Paul Kingswell, NHS Warks
Electoral Wards • Politically relevant • Frequent boundary changes • Large variation in population size • Super Output Areas - Lower (LSOA) and Middle (MSOA) • Not directly associated with admin/constiuency areas • Stable boundaries • Little variation in population size • West Midlands • Wards n = 719, avg pop = 7,800 (LA avg 3,400 - 26,800) • MSOAs n = 735, avg pop = 7,600 (LA avg 6,200 - 9,200) • LSOAs n = 3,487, avg pop = 1,600 (LA avg 1,50-1,700) Small area geographies Chapter 7 Measuring inequalities in small area life expectancy West Midlands Key Health Data 2011/12 Chapter 7 Measuring inequalities in small area lifeexpectancyDaniel Eayres, Jane Fletcher, WMCSU; Paul Kingswell, NHS Warks
Life expectancy at birth by small area, West Midlands 2008-10 By ward By MSOA Life expectancy by small area geography West Midlands Key Health Data 2011/12 Chapter 7 Measuring inequalities in small area lifeexpectancyDaniel Eayres, Jane Fletcher, WMCSU; Paul Kingswell, NHS Warks
Life expectancy at birth by small area, West Midlands Metropolitan County 2008-10 By ward By MSOA Life expectancy by small area geography West Midlands Key Health Data 2011/12 Chapter 7 Measuring inequalities in small area lifeexpectancyDaniel Eayres, Jane Fletcher, WMCSU; Paul Kingswell, NHS Warks
Male life expectancy at birth vs. Deprivation by MSOA, West Midlands 2008-10 Life expectancy by small area geography Chapter 7 Measuring inequalities in small area life expectancy Source: Health profiles – local health, Network of Public Health Observatories; Indices of Deprivation 2010, Department for Communities and Local Government. West Midlands Key Health Data 2011/12 Chapter 7 Measuring inequalities in small area lifeexpectancyDaniel Eayres, Jane Fletcher, WMCSU; Paul Kingswell, NHS Warks
Public Health Outcomes Framework life expectancy inequalities • Indicator 0.2i:Slope index of inequality (SII) in life expectancy at birth based on national deprivation deciles of Lower Super Output Areas (LSOAs) within England [National level]. • Indicator 0.2ii: Number of upper tier local authorities for which the local SII in life expectancy (as defined in 0.2.iii) has decreased [National level]. • Indicator 0.2iii:SII in life expectancy at birth within each English upper tier local authority, based on local deprivation deciles of LSOAs [LA level]. Slope Index of Inequality West Midlands Key Health Data 2011/12 Chapter 7 Measuring inequalities in small area lifeexpectancyDaniel Eayres, Jane Fletcher, WMCSU; Paul Kingswell, NHS Warks
Male life expectancy at birth by deprivation decile showing the SII, Warwickshire 2006-10 Slope Index of Inequality Chapter 7 Measuring inequalities in small area life expectancy Source: Health Inequality Indicators, Network of Public Health Observatories. West Midlands Key Health Data 2011/12 Chapter 7 Measuring inequalities in small area lifeexpectancyDaniel Eayres, Jane Fletcher, WMCSU; Paul Kingswell, NHS Warks
SII for life expectancy at birth by upper-tier local authority and gender West Midlands 2006-10 Slope Index of Inequality Chapter 7 Measuring inequalities in small area life expectancy West Midlands Key Health Data 2011/12 Chapter 7 Measuring inequalities in small area lifeexpectancyDaniel Eayres, Jane Fletcher, WMCSU; Paul Kingswell, NHS Warks
LE is a high profile outcome indicator that needs to be monitored by HWBs, including the assessment of within local authority inequality. • Life expectancy in the West Midlands is continuing to improve but has remained persistently below the national average for both men and women. • The range between the highest and lowest local authority districts LEs in the West Midlands is ~5 years for males and ~4 years for females. • Significant variation in LE at the ward, MSOA and LSOA deprivation deciles levels using 5-years of mortality data. • At all area levels there is a strong association between LE and deprivation. The association is stronger and the relationship steeper for males than for females. • Wide inequalities in life expectancy exist within even those local authorities that have high life expectancies overall. • SII values for WM upper-tier LAs range from 4.8 to 11.7 years for males and 2.8 to 10.3 years for females. • Measuring the change in the SII over time in individual LAs will be problematic as the confidence intervals are wide and long time periods are needed. Summary Points Chapter 7 Measuring inequalities in small area life expectancy West Midlands Key Health Data 2011/12 Chapter 7 Measuring inequalities in small area lifeexpectancyDaniel Eayres, Jane Fletcher, WMCSU; Paul Kingswell, NHS Warks
West Midlands Key Health Data 2011/12 END Chapter 7 Measuring inequalities in small area life expectancy Daniel Eayres, Jane Fletcher, WMCSUPaul Kingswell, NHS Warwickshire