Download

1 / 27
300 likes | 326 Vues
Design Of Sediment Data Collection Programs. G. Douglas Glysson 412 National Center Reston, VA 20192 gglysson@usgs.gov 703/648-5019. Larry Freeman Santa Cruz Field Office 400 Natural Bridges Drive Santa Cruz, CA 95060 lfreeman@usgs.gov 831/460-7494. Monitoring Program Design.

E N D
Design Of Sediment Data Collection Programs G. Douglas Glysson 412 National Center Reston, VA 20192 gglysson@usgs.gov 703/648-5019 Larry Freeman Santa Cruz Field Office 400 Natural Bridges Drive Santa Cruz, CA 95060 lfreeman@usgs.gov 831/460-7494
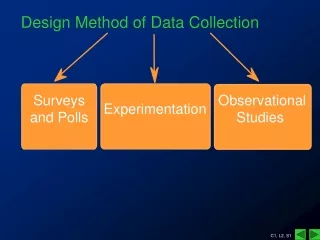
Monitoring Program Design • Defining the objectives of a monitoring program is an essential first step for data-collection network design. • The objectives define the purpose and scope of the monitoring program • Provide the basis for determining if a given network design is adequate. • Quantifying Loads • Compliance with Standards
Multiple Purposes for Monitoring • Analyzing trends, • Establishing baseline conditions, • Studying the fate and transport of sediment and associated pollutants, • Defining critical source areas, • Assessing compliance, • Measuring the effectiveness of BMP’s, • Project monitoring, • Implementation monitoring, • Making wasteload allocations, • Testing models, • Defining a water quality problem, and • Conducting research. • Watershed Monitoring
Watershed Monitoring Program • A watershed monitoring program for sediment is comprised of a series of steps designed to collect sediment and related flow data in order to achieve a stated objective.
Example Objective • By 2015, correct the nutrient- and sediment-related problems in the Chesapeake Bay and its tidal tributaries sufficiently to remove the Bay and the tidal portions of its tributaries from the list of impaired waters under the Clean Water Act.
To achieve this Objective • 1. Estimating the amounts of nutrients and sediment that reach the Bay from nontidal parts of the watershed (load estimation); • 2. Identifying the watershed sources and basin characteristics that affect nutrient and sediment transport (load estimation); • 3. Tracking temporal changes in concentration and loading, and relating them to natural variation or management actions (trend analysis); • 4. Relating temporal changes in loading to temporal changes in Bay water quality (trend analysis); • 5. Calibrating the watershed model in order to evaluate the potential benefits of management action scenarios (calibrate watershed model); • 6. Performing studies to understand the processes that affect nutrient / sediment generation, loss and transport (research).
The Sediment Monitoring Components to meet Objective • Components: • Establish Sediment Monitoring Objectives • Sampling Program Design • Study Scale • Identify Variables • Sample Type – SSC, Bedload, Bed Material, etc. • Sampling Location
Sediment Monitoring Components cont’d • Sampling Frequency and Duration • Station Type • Sample Collection and Analysis Methods • Land-Use Monitoring • Data Management • Reporting • Re-evaluation Process **
Basic Program Design • Examples of sampling schemes and operating programs • A. Daily Record Station using an observer • B. Daily Record Station, pumping sampler • C. Daily Record Station, Surrogate • D. Daily Record Station, Surrogate and Observer • E. Partial Record Station • F. Periodic Station • G. Special Studies
Basic Program Design • Successful operation of sediment data-collection programs is realized through training and experience that emphasize the understanding of the many facets of sediment transport and the functioning of the large array of instrumentation and techniques at one's disposal. • Success also depends on balancing the accuracy needed to carry out the program against the limitations imposed by budget and manpower constraints.
Daily Station using an Observer • 1. Description and purpose of station • The primary use of the streamflow and sediment data is for estimating sediment transport rates into the Bay. • 2.Data Collection • Box Samples (Observer and Hydrographer) • Cross-section Samples (Hydrographer) • Bed material Samples (Hydrographer)
Daily Station using an Observer • FIELD TIME • The hydrographer must make 8 scheduled visits plus one to four (or more) flood visits to the gaging station and collect 12 cross-section data sets. Flood samples may require additional Hydrographer. • The scale of the river, the types of equipment operated, and safety considerations control the size of the field crew.
Daily Station using an Observer - Costs • Laboratory costs • Technician Cross-section Samples • 12 full size analyses @ $145 each = $ 1,740 • 9x5x2 sets EDI sand/silt analyses @ $38.50 each = $ 3,465 • 3, 2-set EWI sand/silt analyses @ $38.50 each = $ 231 • 9x5 bed-material size analyses @ $69.25 = $ 3,116.25 • Observer Box samples (fixed single vertical) • 186 (x 2-sets) observer concentrations @ $16.50. = $ 6,138
Daily Station using an Observer – Costs (cont’d) • Other costs • Observer Fees: 186 sample sets collected @ $28.50 each = $5,301 • Salary USGS Technician GS-9 (one person 12 days routine field, plus 4 days additional person for storms, 5 days data review, computation, and publication) = $369/day x 21 days = $7,749 • Overtime GS-9 for storm sampling for 2 employees = 16 hrs @ $44.61 = $714 • Travel – 4 nights for 2 employees for storm sampling at CONUS rate = $1,168 • Vehicle costs – 12 days, 1 vehicle, $75 per day = $900
Daily Station using an Observer – Costs (cont’d) • Other costs (cont’d) • Equipment – • New D-95, Nozzle head and 6 spare nozzles, and 100 1-liter containers (HIF) = $2,707 + $218 + $1,400 = $4325 • D-74 A1 with insert, 4 spare nozzles, (HIF) note: 1-pint bottles usually free through servicing sedlab = $1,526 + $100 = $1,626 • Sounding reel for bridge box (HIF) = $1,166 • Fabrication of bridge box = $2,225 • Sample Shipping (75 cases at $30/case) = $2,250 • Total net = $42,114.25 • USGS Assessment cost (multiply total net by ~1.7 except HIF purchases) = ($34,997.25 x 1.7 = $59,495) + $7,117 HIF • Final cost = $66,612.325
Daily Station using a Pumping Sampler • 1. Description and purpose of station • The primary use of the streamflow and sediment data is for estimating sediment transport rates into the Bay. • 2.Data Collection • Pumping Samples • Cross-section Samples • Bed material Samples
Daily Station using a Pumping Sampler • 1. Check Samples for Box Coefficient • 2. Costs – may collect more samples than when an observer is used. • 3.Field Time (more visits to service the sampler) • 4. Maintenance of Autosampler • 5. Temperature ranges
Daily Station using a Surrogate Monitor • 1. Description and purpose of station • The primary use of the streamflow and sediment data is for estimating sedimentation rates of a reservoir above the Bay. • 2.Data Collection • Cross-section Samples • Bed material Samples • Operation of the surrogate monitor and possibly an auto-sampler
Daily Station using a Surrogate • 1. Check Samples for surrogate and autosampler correlations • 2. Costs • 3.Field Time • 4. Maintenance of Monitor and Autosampler • 5. Temperature ranges
Partial Record Station • 1. Description and purpose of station • Although the purpose is the same as for the daily-record station, the budget with which to operate the station is smaller. • Similar results are expected, but accuracy will be less • 2.Data Collection • Box Samples - once daily during high flow • Cross-section Samples • Bed material Samples
Periodic Station • 1. Description and purpose of station A smaller budget with which to operate the station is provided, however estimates of annual sediment discharge totals to a reservoir must be computed. The sampling program must generate sufficient data for the construction of a sediment-transport curve. • 2.Data Collection • Cross-section Samples • Bed material Samples
Special Study 1 • 1. Description and purpose of study Estimate total sediment into and out of a reservoir • 2.Data Collection • Site(s) location • Samples • Observer vs Pumping vs Surrogate • Cross section • Surrogates • Bed material and or Bedload Samples
Special Study 2 • 1. Description and purpose of study Estimate total suspended sediment transported in stream X and its major tributary • 2.Data Collection • Location of Sites • Type of data to collect
Special Study 2Sample only two locations. Which are best? Tributary 1 3 Main Channel There are 3 possible site locations. Thickness of line indicates relative magnitude of sediment load. 2
Options: • 1 – main stem above the tributary. 3 and 2 are below the tributary. • Best to place sampling sites at 1 and 3 and add the load to get 2. • Second best would be to place sites at 2 and 3 and subtract 3 from 2 to get 1. • Avoid subtracting two large numbers ( 2 minus 1 to get 3). Errors may over whelm the difference.
ASTM Standard D-6145 Standard Guide for Monitoring Sediment in Watersheds Available from www.astm.org