Download
1 / 3
30 likes | 304 Vues
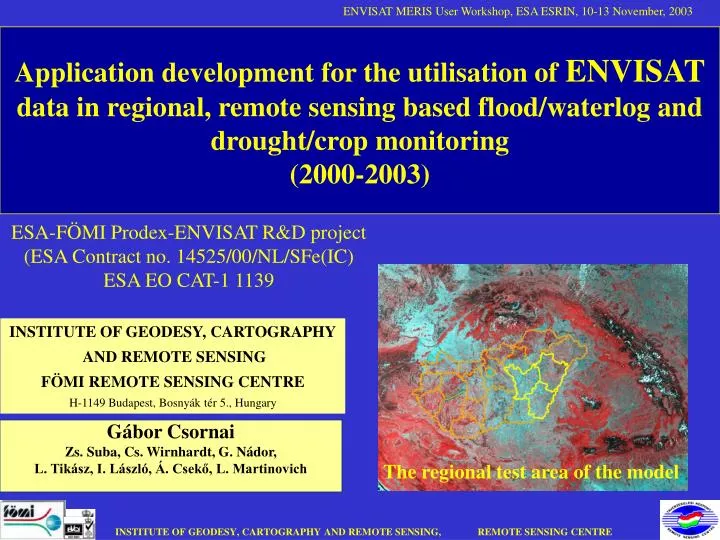
Application development for the utilisation of ENVISAT data in regional, remote sensing based flood/waterlog and drought/crop monitoring (2000-2003). ESA-FÖMI Prodex-ENVISAT R&D project (ESA Contract no. 14525/00/NL/SFe(IC) ESA EO CAT-1 1139. INSTITUTE OF GEODESY, CARTOGRAPHY

E N D
Application development for the utilisation of ENVISATdata in regional, remote sensing based flood/waterlog and drought/crop monitoring (2000-2003) ESA-FÖMI Prodex-ENVISAT R&D project (ESA Contract no. 14525/00/NL/SFe(IC) ESA EO CAT-1 1139 INSTITUTE OF GEODESY, CARTOGRAPHY AND REMOTE SENSING FÖMI REMOTE SENSING CENTRE H-1149 Budapest, Bosnyák tér 5., Hungary Gábor Csornai Zs. Suba, Cs. Wirnhardt, G. Nádor, L. Tikász, I. László, Á. Csekő, L. Martinovich The regional test area of the model INSTITUTE OF GEODESY, CARTOGRAPHY AND REMOTE SENSING, REMOTE SENSING CENTRE
The main steps and objectives of the Prodex-ENVISAT R&D project (2000-2003) • Further extension of the already developed methodologies (FÖMI RSC: operational satellite based National Crop Monitoring and Production Forecast Program, CROPMON 1997-) for rapid, regional flood/waterlog and drought monitoring by increasing the quality (temporal, spatial and spectral) of satellite data • Setting up, extension and testing the model by processing and comparative analysis of available, low and medium resolutionsatellite data (NOAA AVHRR, SPOT VEG., IRS-1C/1DWiFS, Landsat TM and ERS SAR) on a regional (2-3 counties) test area (data from 1998-2000) including semi-operational monitoring phase (data from 2001) • further extension of the model (data from 2002-2003) including near real time monitoring phases and the experimental utilization of ERS SAR and ENVISAT (ASAR, MERIS) data Waterlog map obtained from IRS MOS (1998), IRS WiFS and SPOT VEG. data (2001). Degrees of wet soils and wet vegetation could be identified and differentiated more effectively using the lower spatial but higher spectral resolution SPOT VEG. images Real-time flood monitoring (NOAA AVHRR, IRS WiFS+LISS and Landsat data), 2001 INSTITUTE OF GEODESY, CARTOGRAPHY AND REMOTE SENSING, REMOTE SENSING CENTRE
Regional monitoring and mapping of flood/waterlog and drought events (1998, 2000-2003) could be done efficiently using available low and medium resolution optical satellite data (NOAA AVHRR, SPOT VEGETATION or IRS-1C/1D WiFS) • low price, large area coverage, frequent availability (within 1-3 days) and quick processing capability could compensate for their low or medium spatial (120 ha and 3.6 ha) and spectral (2-5 wide spectral band) resolution • The integration of high resolution radar (ERS SAR) and low/medium resolution optical/infrared (Landsat TM, IRS WIFS, SPOT VEGETATION) data is also a promising tool to enhance the quality of the flood/waterlog monitoring • Further tasks: experimental processing and testing of ESA ENVISAT data (ASAR, MERIS) emphasising the utilisation of MERIS data for regional drought monitoring (2003). • Final report: beginning of 2004. Preliminary results and conclusions NDVI (2000-1998) seriously affected by drought moderately affected by drought weakly affected by drought not significantly affected by drought not affected by drought NDVI difference (June, 2000-1998) map derived from SPOT VEGETATION images. The areas affected by drought can be clearly identified on the Great Hungarian Plain Waterlog maps derived from SPOT VEG. and integrated ERS-2 SAR - SPOT VEG. data INSTITUTE OF GEODESY, CARTOGRAPHY AND REMOTE SENSING, REMOTE SENSING CENTRE