1 / 6

Franck-Hertz Experiment

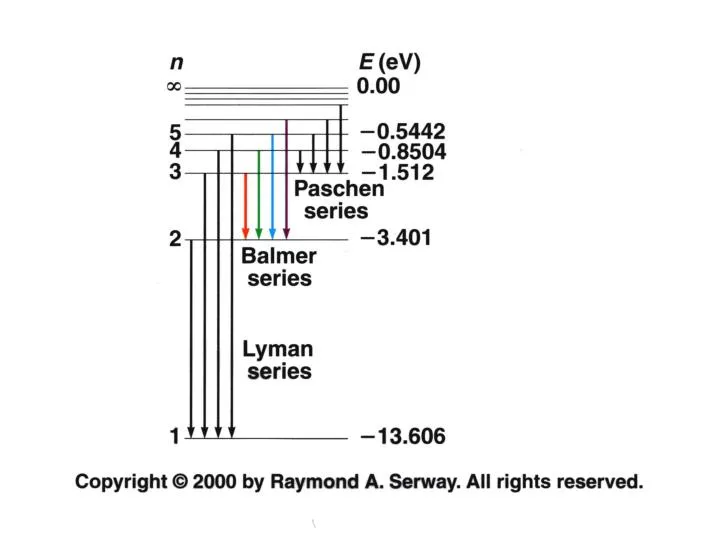
Franck-Hertz Experiment. Figure 2: Simplified plot of electron kinetic energy as a function of position along the trajectory, for two different accelerating potentials. Segments (a) and (b) are shown with E acc = 0.9 E o and segments (c) through (f) are shown with E acc = 1.1 E o.

masato
Télécharger la présentation

Franck-Hertz Experiment

An Image/Link below is provided (as is) to download presentation Download Policy: Content on the Website is provided to you AS IS for your information and personal use and may not be sold / licensed / shared on other websites without getting consent from its author. Content is provided to you AS IS for your information and personal use only. Download presentation by click this link. While downloading, if for some reason you are not able to download a presentation, the publisher may have deleted the file from their server. During download, if you can't get a presentation, the file might be deleted by the publisher.

E N D

Presentation Transcript


  1. Franck-Hertz Experiment

  2. Figure 2: Simplified plot of electron kinetic energy as a function of position along the trajectory, for two different accelerating potentials. Segments (a) and (b) are shown with Eacc = 0.9 Eo and segments (c) through (f) are shown with Eacc = 1.1 Eo. http://oak.cats.ohiou.edu/~piccard/radnotes/states.html

More Related