Download
1 / 48
480 likes | 622 Vues
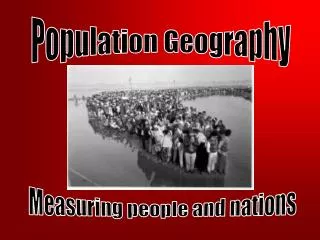
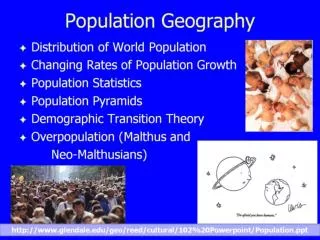
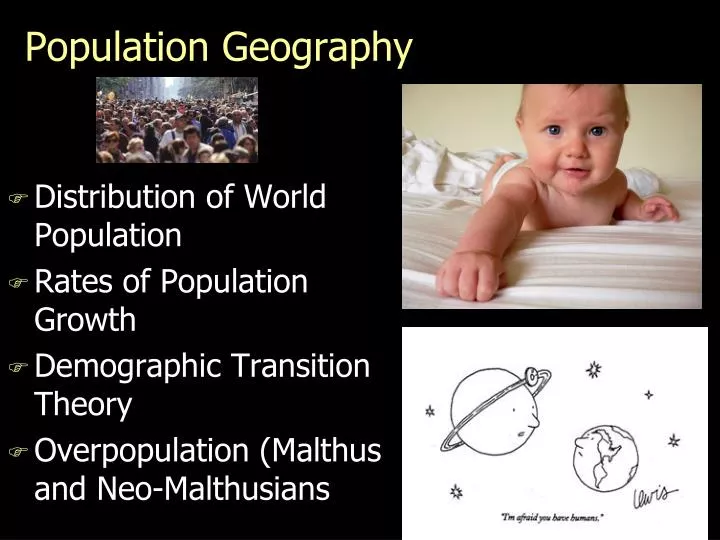
Population Geography. Distribution of World Population Rates of Population Growth Demographic Transition Theory Overpopulation (Malthus and Neo-Malthusians. Humanity has wandered the earth for a very long time. The first hominids roamed eastern Africa 5-7 million years ago.

E N D
Population Geography • Distribution of World Population • Rates of Population Growth • Demographic Transition Theory • Overpopulation (Malthus and Neo-Malthusians
Humanity has wandered the earth for a very long time. The first hominids roamed eastern Africa 5-7 million years ago.
The first modern humans walked out of Africa as hunter-gatherers only 70,000 years ago.
At that time there were probably about 1 million humans on Earth Graph Source: www.census.gov & www.wikipedia.org
When Darwin published On the Origin of Species there were 1billion humans Graph Source: www.census.gov & www.wikipedia.org
When I was born there were3.6billion humans Graph Source: www.census.gov & www.wikipedia.org
6,914,504,604humans today The U.S. Census Bureau estimates the world population at: …and counting!
Las Vegas, Nevada LANDSAT Images 1973 - 2006 Our impacts are growing.
Human Impact on the Environment, 1700 Human Impact on the Environment, 2032 Human Impact on the Environment, 2002 Human Impact on The Environment Source: Hugo Ahlenius. 2003. UNEP/GRID-Arendal. Global Environmental Outlook 3, 2002.
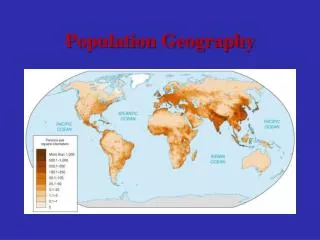
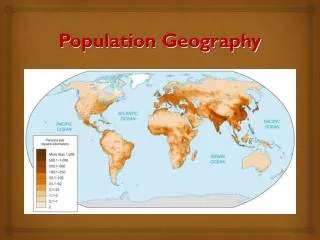
WHERE ARE THE PEOPLE DISTRIBUTED? • Densely Population Areas • East Asia • South Asia • Southeast Asia • Europe • North America • Sparsely Population Areas • arid lands • tropical rainforests • highlands • high latitudes
World and Country Population Totals Distribution and Structure: 3/4 of people live on 5% of earth's surface! Total: 6.8 billion on planet as of March 5, 2010 Current World Population Counter from U.S Census Bureau Five most populous regions and countries REGION POPULATION COUNTRY POPULATION • East Asia 1.6 billion China 1.3 billion • South Asia 1.5 billion India 1.1 billion • Europe 1 billion U.S. 300 million • SE Asia 600 million Indonesia 250 million • Eastern N. America &Canada 275 million Brazil 188 million
Overpopulation is when there are too many people relative to available resources. Simple density is not the determinant.
Human Population Projections How many people will the planet eventually support? The U.S. Census Bureau and the United Nations Statistics Division both agree that world population will level off somewhere between 9 and 11 billion people and then start to fall.
Doubling Time • How long will it take for a population of a given area to double in size? • Divide 70 by the annual population natural increase rate and you find the doubling time. • World = 58 Sub-Saharan Africa = 30 Uganda = 20 years Costa Rica = 80 U.S.A. = 128 years Denmark = 333 years Russia = ? Japan = ? Source: National Geographic Magazine • Example: Bangladesh • 70 / R.N.I. => 70/2.09 = 33.5 years • Bangladesh with a population of 144.3 million people in 2005 will have approximately 288.6 • million people in 2038, if the population continues to grow at current rates.
Total Fertility Rate - the average number of children a women will have in her childbearing years. This rate varies from just over 1 (Japan, Italy) to around 7 (Niger, Mali). The U.S. rate is 2. 2.1 is generally regarded as the replacement rate (the rate at which a population neither grows nor shrinks) in the developed world. In less developed countries this rate should be higher to account for so many children not reaching childbearing age.
Infant Mortality Rate – the number of deaths of children under the age of one per thousand live births. The rate ranges from as low as 3 (Singapore, Iceland) to as much as 150 (Sierra Leone, Afghanistan). The U.S. rate is just over 6. High infant mortality tends to result in higher fertility rates as families seek “insurance” for the loss of children.
World Death Rates • Epidemiological Transition is the shift from infectious to degenerative diseases that occurs with development. • Infectious diseases (developing world) • HIV/AIDS • SARS • Malaria • Cholera • Degenerative diseases (developed countries) • Obesity • Tobacco use
Life Expectancy • Rapid increase throughout world • Infant mortality rate declining in most countries • Antibiotics/immunization • Increasing standards of living
Influences on Birth Rates • Family planning programs – India, Thailand, Bangladesh, etc. • Contraceptive technology • Role of mass media • Radio/TV Soap Operas ("Twende na Wakati" in 1990s Tanzania, which means "Let's Go with the Times" Government Billboard, Indonesia
Demographic Transition Model • Stage one (preindustrial/pre-agricultural) • Crude birth/death rate high • Fragile, but stable, population • Stage two (improved agriculture and medicine) • Lower death rates • Infant mortality rate falls • Natural increase very high • Stage three (attitudes change) • Indicative of richer developed countries • Higher standards of living/education • Crude birth rate finally falls • Stage four (low growth or Z.P.G.) • Crude birth and death rates low • Population stable • Populations aging • Stage five (declining) • Crude birth rates exceptionally low • death rates low • Population decreasing • Populations aging rapidly
Problems with the Demographic Transition Model • based on European experience, assumes all countries will progress to complete industrialization and that this is key issue • many countries reducing growth rate dramatically without increase in wealth or industrial economies – TV and family planning seem to be at work • on the other hand, some countries “stuck” in stage 2 or stage 3, particularly in Sub-Saharan Africa and Middle East
Population Pyramids • Population Pyramids quickly show • age distributions • demographic booms and busts • sex ratios • dependency ratios • Wide base depicts young population; narrow base suggests declining birth rates or growing elderly population.
Population Control • Challenges • Manufacture/distribution expense • Religion • Low female status • Many studies show that fastest way to reduce fertility rate is to encourage more women to get educated • Preference for male children • Female Infanticide
Overpopulation • When consumption of natural resources by people outstrip the ability of a natural region to replace those natural resources.
Jean Antoine Condorcet (1743 – 1794) • predicted that innovation and the resulting increased wealth and choice it creates would provide alternate foods and resources in the future and lead to fewer children per family and improving societies: larger populations are good because they lead to more innovations and ideas. • believed that society was perfectible
Malthus, responding to Condorcet, predicted population would outrun food supply, leading to a decrease in food per person. His Assumptions: Populations grow exponentially. Food supply grows arithmetically. Food shortages and chaos inevitable. Thomas Malthus on Population An Essay on the Principle of Population, 1798
Population J-CurveThis graphs depicts the actual growth in human population from the beginning of agriculture until 2000!
Population and the Environment I = P x A x T Impact = Population x Affluence x Technology • Population-influenced environmental problems: • Global Warming • Habitat Loss / Endangered Species • Resource Depletion • Food Shortages? Not globally, but regionally.
Population, Affluence, and Resource Consumption Source: World Bank, 2012: siteresources.worldbank.org/
Technology, Energy Consumption, and Environmental Impact Individual Annual Energy Use (Goudie, 2006) There has been a dramatic increase in: • individual energy use over time: 3,000 kcal/person - 300,000 kcal/person (each of us in the U.S. has the equivalent of about 100 energy servants) • the power of technology to change the environment: think stone axe versus bulldozer versus atomic bomb. • the scope and severity of environmental impacts.