Download

1 / 48
480 likes | 633 Vues
Multi-Objective Planning and Scheduling with Astronomical Applications. Mark Giuliano – Space Telescope Science Institute. Talk Outline. Why Multi-Objective Planning and Scheduling? Motivation Implementation Approaches Genetic algorithms Example application Challenges

E N D
Multi-Objective Planning and Scheduling with Astronomical Applications Mark Giuliano – Space Telescope Science Institute
Talk Outline • Why Multi-Objective Planning and Scheduling? • Motivation • Implementation Approaches • Genetic algorithms • Example application • Challenges • Visualization tools • Evaluating algorithms
Overall Goal • Schedule astronomical and other space science observations to optimize science return • Reduce the cost of operations as well as enable more science • Multiple mission phases and granularities • Mission proof-of-concept versus operations • Long range planning versus short term scheduling • Oversubscribed scheduling • More science is approved than time is available • Dynamic environment ― change is the norm not the exception • Changing science goals • Changing spacecraft capabilities • Multiple often conflicting goals with multiple constituents • Science return, engineering, calibration, stability of the plan itself … • Hard to quantify and make explicit goals - communication problem
Goals • Effective decision support tools that enable participants to optimize schedules in a collaborative manner...
Goals • Effective decision support tools that enable participants to optimize schedules in a collaborative manner • multiple objectives
Goals • Effective decision support tools that enable participants to optimize schedules in a collaborative manner • multiple participants
Goals • Effective decision support tools that enable participants to optimize schedules in a collaborative manner • enable integration with existing tools
Multi-Objective Scheduling • Effective scheduling of space based astronomy missions requires the ability to make trade-offs among competing mission objectives: • Time on target, minimizing use of consumables, minimizing the use of critical mechanisms, preferring the higher priority science, ... • Objectives are often competing in that improving one objective means making another objective worse • In the short term getting more science done may decrease the mission lifetime • Objectives have different constituents lobbying for them • e.g. mission science community versus engineering • E.g. Solar system observers versus galaxy observers
Traditional Approach • The traditional approach to handling multiple objectives is to combine the weighted average of separate objectives • ∑αi fi(x) • But: combining objectives loses information and pre-determines the trade-offs among them! • In practice this approach requires users to run the planning system multiple times each with different weights for the objectives • Users then compare solutions using ad-hoc methods to select a solution for operations
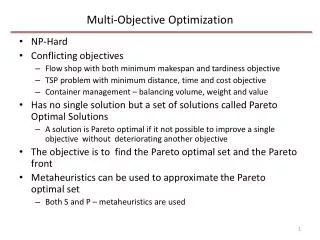
Multi-Objective Solution Approaches Multi-Objective Scheduling: Explicitly maintain and exploit multiple objectives during scheduling Algorithms build up approximate Pareto optimal frontier from a population of candidate schedules i.e. “non-dominated” solutions, such that no other candidate is better, considering all objectives. Each point below represents a complete solution
Comparing the Approaches • The multi objective approach: • - Automates steps that users would manually perform in the traditional approach; • - Provides a more formal basis to select a solution.
Tools for Selecting Solutions • The Pareto frontier gives participants a powerful view into the optimal trade-off space, but users still need to agree on a particular candidate schedule • Need to provide tools that will provide distributed decision support • Mixed-initiative planning • support the end user in making trade offs • Automate when possible but leave final control with the user • Graphical internet-based tools that support multiple participants • Challenges include: human factors, non-simultaneous users, domain-specific scheduling GUIs
Implementation Approaches • Evolutionary algorithms provide a natural fit for finding Pareto-surfaces • Effective on a wide range of problems • Capable of dealing with objectives that are not mathematically well behaved (e.g. discontinuous, non-differentiable). • By maintaining a population of solutions they are capable of representing the entire Pareto frontier at any stage • Lend themselves to parallelization
Evolutionary Algorithms • Based on models of animal Evolution • Core Algorithm; • Generate the initial population • Evaluate the fitness of each member of the population • Repeat until termination • Select the best-fit individuals for reproduction • Breed New individuals through crossover and mutation • Evaluate the individual fitness of new individuals • Replace least-fit population with new individuals
GDE3 • GDE3 is based on differential evolution optimization for single-objective problems (Price, et. al 2005) • For each member of the population, select three others and calculate a candidate child vector by combining the three vectors using binary crossover and a scaling factor • Evaluate the candidate child vector and compare with the original population member as follows: • both infeasible: choose less violated • one feasible, other infeasible: choose feasible • both feasible: choose dominating if present, else choose both • If necessary, reduce population back to size N via non-dominated sorting and crowding distance (to improve diversity along Pareto frontier)
Typical System Architecture GDE3 - Implements multi-objective evolutionary algorithms Creates and evolves decision variable vectors SPIKE - Implements scheduling domain. Creates and evaluates schedules seeded by decision variable vectors
Application: James Webb Telescope • Launch 2013 2014 • Infrared sensors to detect the earliest star formation • L2 orbit 1.5 million km from Earth • 6.2 meter mirror • Tennis court sized sun shield to protect science instruments
Challenge: Momentum Scheduling Solar radiation pressure Sun normal to shield: minimal reaction wheel spin up
Solar radiation pressure Sun not normal to shield: reaction wheel spin to maintain pointing
Momentum Constraint • Solar radiation pressure on the sunshield is absorbed as angular momentum in reaction wheels. • Wheels have a limited momentum capacity. • Momentum dumping requires using non-renewable fuel to fire thrusters. • Potential limiting factor in the mission lifetime. • Momentum accumulation for a target varies over time and the spacecraft roll. • Major factor in the quality of JWST schedules.
JWST Momentum Challenges • The model is a three dimensional vector space. • Momentum accumulation for an observation varies: • Over time in non-linear manner • Momentum accumulation is additive in nature. • Scheduling an observation at a time can either add or subtract from the overall momentum accumulation. • Momentum provides both a hard constraint due to a limited capacity, and a preference to consume as little resource as possible.
JWST Scheduling Objectives • Minimize Schedule Gaps - JWST Contract mandates no more the 2.5% idle time • Minimize MomentumAccumulation • Minimize Observations that miss their last chance to schedule
JWST Experiments Multi-Objective Scheduler + JWST Application Map JWST Scheduling Engine (SPIKE) • Evaluated system using JWST Science Design Reference Mission • Schedule observations to a quantum of 7 minutes in a 22-day momentum bin • Using GDE3 evolutionary algorithm (Java) with Lisp-based SPIKE JWST Scheduler • Implemented parallel domain scheduler driver • Candidate vectors are executed in parallel up to the population size.
Experimental Results • The Blue and Red dots represent different search decompositions • Hollow dots represent the Pareto surface. • The use of parallel evaluations significantly sped up the search process
Evolutionary Algorithm Features • Can seed the initial set of candidate vectors • Uniformly creates solutions with fewer dropped observations (i.e. observations which miss their last chance to schedule) • The GDE framework allows constraint limits to be specified on criteria values • Will first evolve out of constraint violation space • Will not consider solutions with violations for crossover if violation free solutions exit • Want variety in the search space but not at the expense of infeasible solutions • Need to consider the depth versus the breadth of the search space • Is it better to have more generations but less elements in each generation or to have less generations but more elements in each generation?
Selecting Solutions • So you have generated a Pareto-Surface of solutions for a problem, now what do you do? • Still have the problem of selecting a solution for execution • Need to provide tools to end users that enable them to explore the trade-offs in the Pareto Surface • Trade off space can have a high dimensionality making it hard for users to see patterns in the data • Multi-objective problems often require multiple users to be involved • Each user contributes one or more objectives
Visualizing the trade-off space • Traditional X-Y plots show trade offs between 2 objectives • Hard to see relationships between the different graphs • The number of plots increases rapidly as the number of objectives increases
Parallel Coordinate Graphs • Each solution is represented by a single line • Creiteria values are plotted horizontally on a normalized scale • Pros: • Easy to see relationship between the criteria values of different solutions • Graphs scale linearly with the number of criteria • Cons: • Not intuitive in that they need explantions • Graphs can get crowded
Self Organizing Maps • Colors represent different criteria • Circles with wedges represent solutions • The map conveys information with: • The geometry of the color coded shape • correlation between criteria • The placement of the circles on the map • Correlation with criteria values • The size of the wedges within a circle represent criteria values for solutions • The determination of a good self organizing map is itself a multi-objective optimization problem
Crowding and Coordinate Plots What Does this HST Plot tell us?
Interesting Solutions • Can use existing algorithms to display only the interesting subset of a Pareto-surface. • The genetic algorithm used in these experiments has a crowding distance measure • Used to reduce the number of candidates to the population size at each generation • We reused the measure to display only the interesting subset of a Pareto-surface.
A reduced Parallel Coordinate chart Shows the top 25% most interesting solutions What Does this Plot tell us?
Exploring the surface • No single view of the data is always best • Interface needs to provide multiple views that allow users to dynamically explore the Pareto surface • Allow users to adjust bounds on what is displayed • Sort data and or to filter out data • Link together different graphs by selecting solutions
So you generated a Pareto Surface, Now what? Developers Challenges • Need tools which allow developers to compare different multi-objective algorithms • There are many variants for multiple objective algorithms: • High level search decomposition (choice of variables, values) • Parameters controlling search • Number of generations, size of each generation • Developers want to select the best algorithm variant for their particular application domain.
Evaluating Algorithms • Features of planning algorithms: • Runtime space and time performance • Ease of system integration • Transparency (easy to understand results) • Maintainability of the code • Quality of the solutions produced • These features apply to both single and multi-objective algorithms • Evaluating solution quality is different for multi-objective and single objective algorithms
Evaluating Solution Quality • Single objective algorithms produces a single solution for a problem instance • Maximizes an objective function combining multiple criteria • Different single-objective algorithms can be directly compared using the objective function • Multi-objective algorithm produces a Pareto-surface of solutions where • No solution is dominated by another solution for all criteria • Comparing algorithms for a problem requires comparing Pareto-surfaces
Evaluating Surfaces • (Zitzler 2003) There is no Unary function, F, on surfaces such that if F(surface1) > F(surface2) then surface1 is better than surface2 • You can construct binary evaluation functions that detect domination between surfaces • Let C be the Pareto surface obtained by combining surfaces S1 and S2 • The following function detects domination: • If Intersect(S1,C) == S1 and intersect(S2,C)== NULL then S1 dominates S2 • Algorithms 1 dominates Algorithm 2
Binary Evaluation Metric 1 • You can construct binary evaluation functions that give metric comparisons between surfaces: • Define F(S1,S2) = Length(Intersect(S1,C)) / Length(S1) • C is the combined Pareto surface of S1 and S2. • In the example • F(A1,A2) = 4/5 • F(A2,A1) = 1/5
Binary Evaluation Metric 2 • Define E(P1,P2) as the factor by which one Pareto surface is worse than another with respect to all objectives. • E(P1,P2) is the minimum factor e such that for any solution in P2 there exists a solution in P1 that is not worse by a factor of e in all objectives. • If E(P1,P2) is smaller than E(P2,P1) then the indicator implies that P1 is preferable to P2.
Formalism versus Graphics • How well do the binary evaluation metrics perform compared to intuitions gained from graphic displays of Pareto-surfaces? • Can we use metrics to evaluate algorithms? • We compare results for two sets of experiments • For the purpose of this talk we will just compare the blue algorithm with the red algorithm
Metrics vs Visualization (1) • Both of the metrics indicate a preference for the blue search. • This agrees with our visual intuition as we see more blue than red in the plots. • The metrics do not show features we can easily see from the charts: • The broad blue search provides a better min gap values at the cost of a high number of dropped observations
Metrics vs Visualization (2) • Both of the metrics indicate a preference for the blue search. • This agrees with our visual intuition as we see more blue than red in the plots. • The metrics do not show features we can easily see from the charts: • The delayed search is much better in terms of momentum. • The two approaches are competitive if we do not consider momentum.
Metrics vs Visualization • Take home thoughts: • Metrics can provide a high level comparison of Pareto-surfaces • Metrics miss intuitions that can be gained through the use of visualization tools. • Use both techniques
Evaluating Surfaces - Analogy • Selecting an evolutionary algorithm out of a set of algorithms is like selecting a solution for execution out of a Pareto Surface • If there is a dominating algorithm/solution then it will be selected • If there is no domination then it is up to the user to otherwise it is up to user to select a algorithm/solution • What is needed are tools that allow users to examine and manipulate Pareto-Surfaces Which Schedule Should I select? Which Algorithm Should I select? Programmer Scheduler
Overview • Multi-Objective algorithms have advantages over the traditional approach of combining criteria with a weighted average • Do not pre-determine trade-offs between criteria • Provide end users with a Pareto surface of solutions to select from • Automate manual steps of adjusting criteria weights • Existing Multi-Objective Algorithms are effective in building uniformly sampled approximations of the Pareto surface • Challenges in providing dynamic visualization tools for exploring the surface and selecting solutions