Download
1 / 32
320 likes | 461 Vues
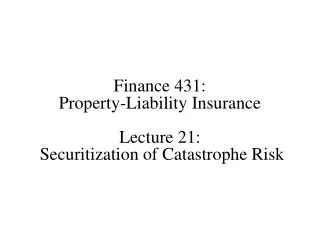
Extreme Catastrophe Exposures Are the Capital Markets the Answer?. Grahame Chilton, CEO, Benfield. Overview. Top 10 Most Costly Hurricanes in US History (Insured Losses). Source: Swiss Re sigma No 2/2006, losses indexed to 2005.

E N D
Extreme Catastrophe ExposuresAre the Capital Markets the Answer? Grahame Chilton, CEO, Benfield
Top 10 Most Costly Hurricanes in US History (Insured Losses) Source: Swiss Re sigma No 2/2006, losses indexed to 2005
Number of Major (Category 3, 4, 5) Hurricanes Striking the US by Decade 1930s – mid-1960s: Period of Intense Tropical Cyclone Activity Mid-1990s – 2030s? New Period of Intense Tropical Cyclone Activity 10 Est. Tropical cyclone activity in the mid-1990s entered the active phase of the “multi-decadal signal” that could last into the 2030s Already as many major storms in 2000-2005 as in all of the 1990s *Figure for 2000s is extrapolated based on data for 2000-2005 (6 major storms: Charley, Ivan, Jeanne (2004) & Katrina, Rita, Wilma (2005)). Source: Tillinghast from National Hurricane Center: http://www.nhc.noaa.gov/pastint.shtm.
Probability of Major Hurricane Landfall (CAT 3, 4, 5) in 2006 Forecast US land falling hurricane activity 30% above the 1950 -2005 norm in 2006 (Forecast 4th August 2006) Professor Mark Saunders, Dr. Adam Lea, Tropical Storm Risk Consortium
Comparing 2004 to Past Years All Years (1899-2004) With 3 or More Hurricanes MakingLandfall Between Mobile Bay & Jacksonville, FL Only 2004 Has Had 4 Hurricanes Making Landfall in this Region
Katrina & Rita: storm tracks Source : Rigzone – 26/9/2005
Hurricanes Katrina/Rita: Damage to Oil Platforms and Rigs in Gulf of Mexico No. of Platforms/Rigs Destroyed, Damaged or Adrift, as of October 4, 2005. Source: Minerals Management Service (MMS), US Department of the Interior.
Estimated Energy Losses 2004/2005 $18.8B Total Losses OIL, Assureds Retentions Uncovered Claims $10.2B Total Losses OIL, Assureds Retentions Uncovered Claims Commercial Market Losses Commercial Market Losses CAT Losses $9.1B $12.9B CAT Losses $5.1B $7.7B $3.8B Operational Losses Estimated Premium $2.8B $2.6B Estimated Premium $2.8B Operational Losses 2005 2004
2004-2005 Combined $18.0B Global Commercial Energy Market Insured Losses $5.6B Global Commercial Market Premium Global Commercial Market Premium Estimated Combined Loss Ratio (2004/2005) = 321%
2005 Hurricane Season Source: WeatherUnderground.com, January 18, 2006.
Largest insured catastrophe losses Source: Swiss Re
The new market spectrum Retro Hedge fund SPVs Hybrid capital Property Cat Reinsurance ART Cat bonds Capital markets
Many Programs Partially Placed US Property Catastrophe Reinsurance: June 06 June 2006 Renewals 2005 BOUND PROGRAMS VS 2006 MARKET QUOTES 2005 Bound 2006 Quotes Rate On Line Price Increases Outstrip Risk Probability of Attachment1 1 Based on Benfield analysis using RMS v5.0
Gulf Exposed/Loss Sensitive Programs Hit Hardest AVERAGE ROL CHANGE FOR TOTAL BENFIELD LIMIT PLACED ( Percent ) Region2006 ROL2005 ROLChange Southeast 13.60 5.65 140.45 Nationwide 12.60 6.07 108.29 Florida 20.20 9.97 102.45 Northeast 4.30 3.45 25.93 California 6.70 5.96 11.94 Midwest 6.20 5.98 4.38 Other* 6.32 5.63 11.38 Total 10.70 6.11 74.57 Source: Benfield analysis of Jan – June placements. Other includes four companies with Puerto Rico and Texas exposure. PRICE IMPACT BY RENEWAL DATE (Percent Increase) With Ceded Loss HI LO AVG January 112 10 45 June 236 74 154 July 164 65 104 Without Ceded Loss HI LO AVG January 40 0 13 June 35 6 20 July 57 36 47 Source: Benfield analysis of Jan – July placements. *Other includes four companies with Puerto Rico and Texas exposure
US Property Catastrophe: Limit purchased AVERAGE PROGRAMME LIMIT INCREASES VERSUS 2005 ( Percent Change )
Cat Bonds Risk Transfer to Capital Markets Sidecars Startups Risk Financing from Capital Markets Capital Raising Benefits of Increased Pricing & Improved Risk Management Retained Earnings Solutions for Current Dislocation RMS Estimate of New Capital Required $124 billion
Cat Bonds Risk Transfer to Capital Markets Sidecars Startups Risk Financing from Capital Markets Capital Raising Benefits of Increased Pricing & Improved Risk Management Retained Earnings Solutions for Current Dislocation RMS Estimate of New Capital Required Merrill Lynch JV Starbound Re Montpelier, Glacier, Lancashire $124 billion
A Benfield Solution: Starbound Re • A sidecar (dedicated underwriting vehicle) created by Benfield and Renaissance Re in May/June 2006 • Specifically structured for the Florida exposures of Benfield customers using detailed portfolio data • Created US$285 million of additional Florida catastrophe capacity exclusive to Benfield • No other broker was able to respond to the Florida capacity crunch in this way • Numerous Benfield customers with Florida exposures benefited and were able to complete their renewal programmes as a result
Alternative Capacity Will Become More Significant • Bermuda sidecars, start-ups and recapitalization offset some reduction in other region capacity / additional limit for 2006 property cat renewals Traditional Catastrophe Coverage Alternative Catastrophe Coverage • ILW placements expected to double this year • 2005 limit placed approx. $2bn • 2006 limit expected: $3bn - $4bn • Considerable activity in Cat Bond market following Katrina • Record number of first time sponsors in 2005 (AXA, Zurich, FM Global, Montpelier Re) • Capital Markets appetite may better serve as stabilizing force for large events • 2004 global reinsurance surplus = approx. $377bn • 2004 global securities and bank assets = approx. $144trillion SAMPLE 6/1 PROPERTY CAT LIMIT DISTRIBUTION ( Percent )
The new market spectrum Retro Hedge fund SPVs Hybrid capital Property Cat Reinsurance ART Cat bonds Capital markets
Benfield Capabilities Retro Hedge fund SPVs Hybrid capital Property Cat Analytics Reinsurance ART Cat bonds Capital markets