Download
1 / 47
470 likes | 669 Vues
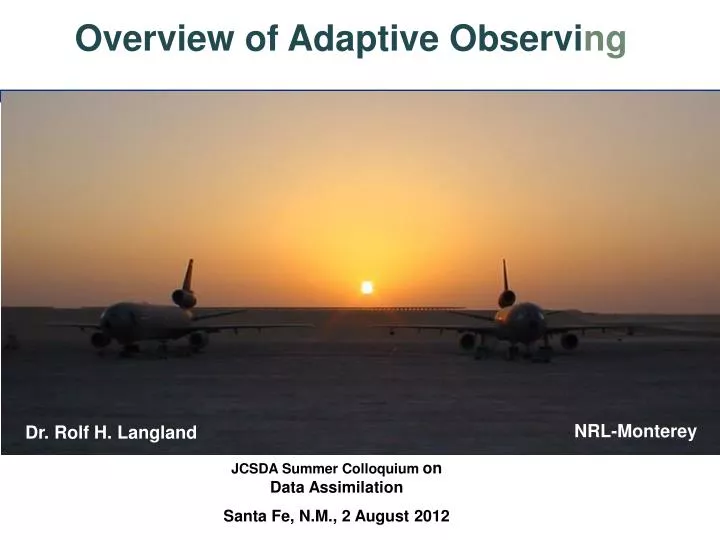
Overview of Adaptive Observi ng. Rolf H. Langland (NRL-Monterey). NRL-Monterey. Dr. Rolf H. Langland. JCSDA Summer Colloquium on Data Assimilation Santa Fe, N.M., 2 August 2012. Outline of Presentation. What is adaptive (“targeted”) observing? Targeting methodologies

E N D
Overview of Adaptive Observing Rolf H. Langland (NRL-Monterey) NRL-Monterey Dr. Rolf H. Langland JCSDA Summer Colloquium on Data Assimilation Santa Fe, N.M., 2 August 2012
Outline of Presentation What is adaptive (“targeted”) observing? Targeting methodologies Targeting field programs (1997-2012) Challenges for adaptive observing Note: this talk describes adaptive observing for atmospheric applications – ocean adaptive observing techniques have also been developed
What is Targeted Observing ? If one has the capability to add ~10-10,000 special atmospheric observations that can be assimilated to improve the forecast of a particular weather event, can the locations be determined using objective (e.g., model-based) methods? Optimization problem with two constraints… 1. The probability of making an analysis error at a particular location 2. The intrinsic instability of the flow in that location … sensitivity Can the data assimilation method accurately incorporate the special observations? [MORE IMPORTANT THAN INITIALLY BELIEVED !!]
Targeted Observing Objectives • Improve 0 to 7 day forecasts of high-impact weather: • Tropical cyclone track • Extra-tropical winter storms [wind, precipitation] • Forecast systems: • Global and regional deterministic models of operational forecast centers • Ensemble forecast systems [goal: reduce forecast uncertainty]
Targeted Observing Resources • Dropsondes from reconnaissance aircraft • On-demand upper-air soundings from land- and ship-based radiosondes • Land and ship surface observations • Airborne lidar • Un-manned aerial vehicles • On-demand satellite rapid-scan wind observations
Objective vs. subjective “targeting” • Objective targeting involves use of an adjoint model or ensemble system to identify observation target areas through estimates of analysis uncertainty and potential forecast error growth • Subjective targeting is based on inspection of map features or forecaster intuition • Jet streaks • PV anomalies • Hurricane structure Goal of objective targeting is not to correct the largest analysis error, but the analysis error that leads to the largest forecast error 6
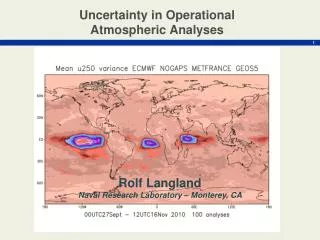
Uncertainty in Atmospheric Analyses GFS | ECMWF Jan-Dec 2010 ms-1 Root-Mean Square of Analysis Differences: 300mb u-wind
Singular Vectors in 72-hr East Coast Storm Forecast Initial Time Total Energy 12Z 22 Jan 2000 Final Time Sfc Pressure 12Z 25 Jan 2000 SV 1 SV 2 SV 3 Forecast error growth is controlled by a few rapidly-growing perturbation structures 8
Large error growth in a 5-day forecast NOGAPS Forecast hour Forecast Error Potential Target Region Error starts in mid-Pacific Remnant of tropical storm Kiko Global total energy error norm (J kg-1)
U-2 Hurricane Flights (1960-1968) Before the days of “objective targeting” In 1956, the US Weather Bureau, reacting to the devastation of three consecutive hurricane strikes along the east coast of the United States, received Congressional funding to establish the National Hurricane Research Project to conduct research on tropical cyclones that would advance our scientific understanding of these storms and provide the means to improve the accuracy of future hurricane forecasts. During this process, the NHRP began to ponder the horizontal thermal and vertical wind structures in the upper Troposphere / lower Stratosphere region of tropical cyclones. At the time, there were no high-altitude aircraft adequate to probe these upper regions over the tops of tropical cyclones, except the U-2. Beginning in early 1960, the AFCRL made available a U-2 to the Weather Bureau's hurricane research project (NHRP) and its component Project Stormfury (an experimental hurricane modification project) providing high-altitude photographs and gathering meteorological data in the Troposphere region over the hurricanes. Storms flown by the AFCRL U-2 included Hurricanes Donna (60), Carla (61), Esther (61), Flora (63), Beulah (63), Ginny (64), Isbell (64), Betsy (65) and Beulah (67) to name just a few.
Field Programs for Targeted Observing • Programs for winter storm targeting: [Operational*] • North Atlantic (FASTEX-1997, ATREC-2003) • Eastern North Pacific (NORPEX-1998, WSRP-1999-2012) • Entire North Pacific (Winter T-PARC 2009) • Programs for hurricane / tropical cyclone targeting: • North Atlantic (NOAA-HRD, 2000-2012) • Western Pacific (DOTSTAR, 2003-2012) • T-PARC (TCS-08) 2008 • Antarctica: CONCORDIASI (2010-2011) • Participants: Meteo France, ECMWF, UKMO, NRL, NCEP, NCAR, NOAA-AOC, NOAA-HRD, USAF Hurricane Hunters, NASA, CIMSS, MIT, Univ. of Miami, others
Shannon Goose Bay St. John’s St. John’s NOAA G-IV flights Learjet flights FASTEX – first objective targeted observing program January – February 1997 8 targeted dropsonde missions tasked by Meteo France & NRL Adjoint-based targeting 12 targeted dropsonde missions tasked by NCEP and NCAR Ensemble-based targeting
FASTEX targeting example (IOP-17) Sensitivity to 700mb Temperature Forecast Verification Region J = Vorticity (measure of cyclone intensity) WARMER COLDER Interpretation: the 42-hr forecast error over UK is most sensitive to the structure of this trough Adjoint-based target guidance to improve 42-hour forecast of intense cyclone over Ireland and Great Britain
The observation “target region” • A region in which initial condition error is expected to cause significant forecast error or uncertainty at the forecast verification time • Occur in dynamically significant regions (baroclinic zones, strong advection, jet entrance / exit) • The key initial “error” may involve relatively small changes to temperature and wind structure • Does not necessarily correspond to most prominent synoptic features (surface low, PV max)
FASTEX IOP-17 E-W Cross-section of Singular Vector target 15 15
Dropsonde Aircraft in FASTEX (1997) Manned Reconnaissance Aircraft NOAA – GIV GPS Dropsonde – Deployed from 24,000 – 40,000 ft. Dropsondes, which are radiosondes deployed from aircraft, measure temperature, humidity, pressure, and wind speed/direction, as they fall through the atmosphere Temperature Accuracy +/- 0.2% at –40C 16
Target Planning Time-Line Current time Decision time Adaptive sampling (analysis) time Verification time ti td ta tv t Targeting Calculations Observations How do we choose the optimal deployment of observations to improve a forecast between times ta and tv? It has proven feasible to prepare targeting guidance ahead of time, and deploy in-situ observational resources (e.g., dropsondes) into identified target regions
Vertical cross-section of sensitivity information from NOGAPS adjoint model Jet Stream Level Dropsonde profiles Surface Level Dropsondes provide vertical profiles of temperature, wind, and humidity in region of maximum dynamic sensitivity (error source region)
NORPEX Targeting Mission (1998) Forecast Verification + 2 days SV Target Area NCEP NRL 19
NORPEX-98 Targeting Example (48-hr impact) 300mb wind 300mb wind SV Target Area With targeted dropsondes: 48hr fcst error* reduced by 35% in verification region Sea Lev Pres Sea Lev Pres *Fcst error is E-weighted error of T, u, v, ps from surface to 250mb SV Target Area NOGAPS 20
NORPEX-98 Targeting Example (96-hr impact) Impact of 30 dropsondes on a 96-hr NOGAPS Forecast during NORPEX (Feb 1998) Control Forecast Forecast with Targeted Data Target Region for special dropsonde observations Significant Enhancement of Precipitation in Storms over California and Florida
Impact of NORPEX targeted dropsondes 16 January – 27 February 1998 (NRL-NCEP) In 45 forecast cases, ~ 10% mean error reduction over western North America, using NOGAPS forecast model Approx 700 dropsondes 45 forecast cases RMSE 500mb htof2-day forecasts 10% mean error reduction (45 cases) IMPROVED FORECASTS (n=35) DEGRADED FORECASTS (n=10) error with targeted dropsondes (m) Langland et al. 1999 (BAMS)
Results of Early Targeting Field Programs (1997- 2003) • FASTEX, NORPEX, WSRP, ATREC (mid-latitude programs), and tropical cyclone targeted with dropsondes – primarily involve small sets of in-situ observations deployed intermittently • Average 10% reduction in 1-3 day forecast error over regional verification areas – maximum reductions as large as 50% in certain cases • Approx. 60-70% of forecast cases improved • Target areas incompletely surveyed in vast majority of field program cases … • Impact per-observation of targeted data is about 3x larger than observations placed randomly, but total impact is generally limited by the relatively small number of targeted data Based on studies at ECMWF, Meteo France, NOAA, NRL and other centers
Increasing the impact of targeted observing Goal 1: Increase the average beneficial impact of targeted data in deterministic and ensemble forecasts – Goal 2: Increase the percentage of forecasts that are improved by targeted data – • Assimilate larger amounts of satellite, remote-sensed, and in-situ observations in target regions - do not rely on intermittent small sets of observations
Targeting and Observation Impact Questions • Why does assimilation of “good observations” make some forecasts worse ? • Why doesn’t the assimilation of 10-50 dropsondes produce larger impacts on forecast skill? • Examine the data assimilation procedure
Impact of Observations on Forecast Error OBSERVATIONS ASSIMILATED Xb Xa 00UTC +24h The forecast error difference, , is due to the assimilation of observations at 00UTC Langland and Baker (Tellus 2004)
USING ADJOINT-BASED OBSERVATION IMPACT TO EVALUATE IMPACT OF TARGETED DATA [WSRP DROPSONSDES] 1 Jan – 28 Feb 2006 00UTC Analysis Beneficial (-0.01 to -0.1 J kg-1) Non-beneficial (0.01 to 0.1 J kg-1) NOAA-WSRP 191 Profiles Small impact (-0.01 to 0.01 J kg-1) Date: Jan-Feb 2006 Result: Average targeted dropsonde profile impact is beneficial – placement in sensitive regions provides 2-3x larger impact than average radiosonde profile • Observation impact is determined by size of innovation, assumed observation and background errors, distribution of other nearby observations and intrinsic error growth properties of the atmosphere in that location
FORECAST ERROR INCREASE FORECAST ERROR INCREASE FORECAST ERROR REDUCTION FORECAST ERROR REDUCTION
Probability of improving or degrading a forecast Probability of forecast degradation from assimilation of new observations (percent) Forecast degradations occur because the observation and background errors are not precisely known – however, our estimates of these errors work well if the number of assimilated observations is very large …. Many observations – small chance of forecast degradation 50 Few observations – significant chance of forecast degradation 1,000 10 100 10,000 0 Number of additional data assimilated 1 One observation CAN change a forecast But adding small sets of observations is not a reliable method for targeted observing
Advanced Targeting Hypotheses • Amount and quality of data added is more important than small inaccuracies in target area guidance [better to cover entire target area than to place a few observations in location of maximum sensitivity] • Continuous addition of targeted data for several days leading up to the critical analysis time is essential for larger forecast impact [conditioning of background]
Satellite observations = targeting resource Observation selection is a form of “targeting” • Radiances from infrared and microwave sounders on polar orbiters • Cloud and water vapor motion vectors from geostationary platforms • Surface winds from space-based scatterometers LESS THAN 2% OF ATMOSPHERIC OBSERVATIONS ARE ACTUALLY ASSIMILATED FOR OPERATIONAL FORECASTING • Satellite channel-selection • Regional variations in satellite observation data-thinning • Addition of rapid-scan AMVs
Rapid-Scan Satellite winds for Targeted Observing Regular: 30min scan RAPID-SCAN: 3min sampling Improved data quantity and quality AMVs at 08GMT, 7th August 2007, during TCs Wutip and PabukSource: JMA, CIMSS
34 34 observations,
Medium-RangeTargeted Observing Example Target Regions for 72h Forecast of Hurricane Floyd HURRICANE VORTEX at targeting time UPSTREAM MID-LATITUDE SHORT-WAVE at targeting time NOGAPS Adjoint Sensitivity Gradient VERIFICATION AREA Target: 00UTC 13 Sep 1999 Forecast Verifies: 00UTC 16 Sep 1999
Rapid scan targeting for Hurricane Katrina Average 12% reduction in track forecast errors [24hr-120hr] Upstream trough affects medium-range forecasts Katrina position at 00UTC 30 Aug 2005 Katrina position at 00UTC 27 Aug 2005 Region around cyclone vortex is sampled by dropsondes RS-wind vectors: assimilated every 6-hr from 00UTC 20 Aug to 120UTC 29 Aug 2005 Source: NOAA, CIMSS
Rapid-Scan and Dropsonde targeted observing in super-typhoon Sinlaku 10-18 Sep 2008 [TCS-08] Rapid-Scan Winds Rapid-scan winds produce significant reduction in 24hr forecast error energy norm – new data in areas that cannot be sampled with dropsondes -1.95 J kg-1 Forecast Error Reduction Forecast Error Increase Dropsondes and Driftsondes Dropsondes in this case do not reduce 24hr forecast error energy norm + 0.10 J kg-1 Forecast Error Reduction Forecast Error Increase
DOTSTAR Targeting Mission 00UTC 10Sep 2008 On average, small improvements in track forecasts from added dropsondes Super-Typhoon Sinlaku Target Areas [much larger than area sampled with dropsondes (at left)] Targeting guidance prepared Forecast verification 8th 12th 10th Targeted observations deployed
Winter T-PARC Field Program Feb 2009 TARGETED SPECIAL RAOB PROFILES TARGETED SPECIAL AMDAR DATA Added about 2% to total 24hr global forecast error reduction from global aircraft observations 24,423 observations Added about 18% to total 24hr global forecast error reduction from radiosonde profiles at 06UTC and 18UTC 29, 898 observations
CONCORDIASI Field Program Sep-Dec 2009 Largest sensitivity to targeted observations on the periphery of Antarctica Targeted dropsondes equivalent to addition of three full-time raob stations
Successes of Targeted Observing • The theory of targeted observing to improve short- and medium-range forecasts has been validated • Targeted observing has the potential for significant improvement to deterministic and ensemble forecasts of high-impact weather • Several targeting programs are in routine operations: [NOAA: WSRP, N.Atlantic Hurricanes, Taiwan:DOTSTAR] • The targeted use of rapid-scan AMVs is now a routine part of operations at JMA and NESDIS (for land-falling tropical cyclones)
Limitations and Challenges for Targeting • Dropsonde targeting provides only partial surveys of target areas, relatively small amounts of data, and is thus not able to achieve the full potential of targeted observing • Addition of rapid-scan winds provides more-complete surveys of target areas, and larger forecast error reductions, but cannot be used in all situations because of logistical limitations • In-situ data (radiosondes, dropsondes, aircraft) appears necessary to supplement current satellite data, especially in cloudy areas, where targeted data are most needed …
Research Questions for Targeted Observing • How much benefit can we obtain by “tuning” the network of existing regular satellite and in-situ observations in a targeted sense? • Targeted satellite data thinning • Targeted satellite channel selection • On-request feature-track wind data for anticipated high-impact weather events • Increase observations from commercial aircraft in certain regions • Request radiosondes at non-standard times
WMO Targeting Recommendations • Focus on critical deficiencies that exist in the current global observing network – note that large-scale differences in analysis uncertainty has not been eliminated by huge amounts of radiance data • Aircraft data should be maintained or expanded in regions where current in-situ observations are sparse [e.g., oceans, South America, Africa] • Current radiosonde stations should be maintained with increases in off-time [06Z, 18Z] soundings in remote locations and regions with sparse aircraft data • Where possible, rapid-scan and other satellite resources should be used in targeted mode to improve forecasts of high-impact weather events in regions with large analysis uncertainty
For additional information: Dr. Rolf H. Langland Data Assimilation Section Naval Research Laboratory Monterey, CA 93940 Rolf.langland@nrlmry.navy.mil