Download
1 / 37
380 likes | 705 Vues
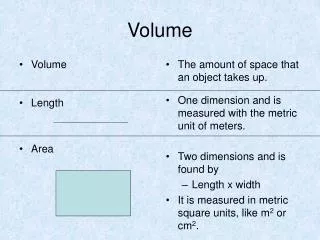
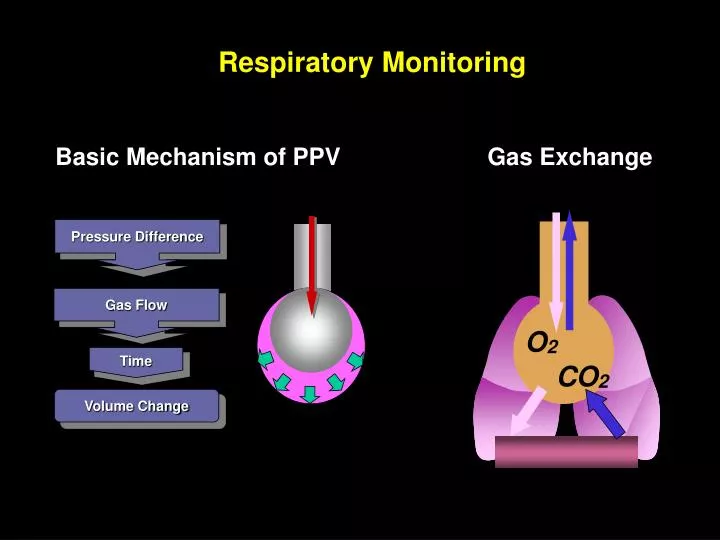
Gas Exchange. Pressure Difference. Gas Flow. O 2. Time. CO 2. Volume Change. Respiratory Monitoring. Basic Mechanism of PPV. Pressure – Flow – Time - Volume. V / P / V. V or V. t. P or V. Curves. Loops. on the ventilator display. - to assess patient-ventilator synchrony

E N D
Gas Exchange Pressure Difference Gas Flow O2 Time CO2 Volume Change Respiratory Monitoring Basic Mechanism of PPV
Pressure – Flow – Time - Volume V / P / V V or V t P or V . . Curves Loops on the ventilator display • - to assess patient-ventilator synchrony • to get some information on respiratory mechanics under dynamic conditions (!) • to detect erroneus ventilator settings • to guide in the search for optimal ventilator settings
The Pressure-Volume Curve: Useful at bedside? How to monitor at bedside? 1) PV-tools +/-
Assessment of Static P-V Curve Volume Volume Super-syringe method: Stepwise inflation from a big syringe with multiple occlusions at each volume to record recoil pressure • Time consuming • Cumbersome to perform • Difficult to standardize • Patient must be paralyzed • Great risk of oxygen desaturation Pressure Pressure
Rimensberger PC Crit Care Med 1999; 27:1946-52 Downie JM et al. AJRCCMe- publ February 5, 2004 Jonson B AJRCCM 1999;159:1172–1178 Is the static PV-curve useful?
Pressure measurements under dynamic conditions ETT 3 mm OD Sondergaard S Ped Research 2002; 51: 339-45
Overdistention Index: C20/Cdyn Volume C20 Cdyn Pressure 0.8 Pmax Pmax Kárason S Acta Anaesthesiol Scand 2001; 45: 173 Kárason S Acta Anaesthesiol Scand 2000; 44: 571 Monitoring of the dynamic cycle: Is it better?
Lung protection and the open lung concept How to monitor at bedside? 1) PV-tools +/- 2) O2-response? Brazelton TB Crit Care Med 2001; 29:2349
The oxygen response (limitations) P/F-ratio, oxygen delivery and Crs during PEEP steps Lichtwarck-Aschoff M AJRCCM 2000; 182:2125-32
Recruitment Overdistension tidal volume static PIP (Pplat) - PEEP The oxygenation response: Can it be used? PEEP and Vt effects in ALI "static" compliance: Cst = Burns D J Trauma 2001;51:1177-81
PEEP Prevalent overdistention Plateau Balance Prevalent recruitment 50 40 25 30 Airway pressure [cmH2O] 15 20 15 15 20 10 0 0 15 20 5 10 PEEP [cm H2O] Constant VT : Plateau - PEEP [] L. Gattinoni, 2003
Prevalent overdistention PaCO2 PaO2 Balance Prevalent recruitment 100 80 60 [mmHg] 40 20 0 20 0 5 10 15 PEEP [cmH2O] Constant VT : PaCO2 and PaO2 L. Gattinoni, 2003
b) flow diversion VA VA PaO2 PaO2 PaCO2 PaCO2 O2-improvement = Shunt improvement = a) recruitment L. Gattinoni, 2003
1 1 2 2 1 1 1 1 1 1 – – PEEP 0 PEEP 20 Prevalent overinflation = dead space effect PaO2 and PaCO2 increase L. Gattinoni, 2003
Overdistention starts PEEP 25 PEEP 20 PEEP 15 PEEP titration CO2-response Oxygenation PEEP 10
Steps of 5 cmH2O to 40/25 25/10 Overinflation ends Overinflation starts The open lung concept: Maximum dynamic compliance and best oxygenation at the least pressure required Pressure control ventilation 25/10
12 11 10 9 11 Continuous blood gas monitoring during HFO CDP: 13 Overdistention Collapse
PECO2 PETCO2 PACO2 Ventilated/ perfused lung Alveolar VD/VT Anatomic VD/VT PcCO2 PvCO2 PCO2 cascade VCO2 PvCO2 PaCO2 L. Gattinoni, 2003
End-tidal PCO2 = 1 Arterial PCO2 Ideal gas exchange Alveolar PCO2 = Arterial PCO2 Alveolar PCO2 = End-tidal PCO2 NO SHUNT NO ALVEOLAR VD/VT
Single breath CO2-tracing • Phase III Alveolar gas – called plateau but ascends gradually due to • sequential emptying of lung regions with different V/Q-ratios • within units V/Q mismatching secondary to incomplete gas mixing • the continual release of CO2 into the alveoli during expiration Phase II Rapid S-shape upswing = washout of convective airway with alveolar gas Phase I CO2-free = gas from airways Modified from “The Single breath test for carbon dioxide” by Roger Fletcher (1986)
CO2 in ventilatory monitoring etCO2 endtidal value FeCO2 fraction of CO2 in expired gas VCO2 minute elimination (”production”) VTCO2 tidal elimination
Volumetric Capnography (NICO2) Single Breath CO2 Analysis Validated against a metabolic analyzer by Kallet et al, Resp Care 2005 and used in many studies for dead space fraction measurements
Volumetric Capnography Single Breath CO2 Analysis CO2 and Volume instead of CO2 and Time Capnogram
Volumetric Capnography Single Breath CO2 Analysis III II I
Indicator of Lung Overdistension During PEEP Titration Optimum End Expiratory Airway Pressure in Patients with Acute Pulmonary Failure Suter PM, Fairley HB, Isenberg MD. NEJM 1975 Best PEEP corresponds to the lowest dead space fraction and the highest compliance
Indicator of Lung Overdistension During PEEP Titration Effects of PEEP on Dead Space and its Partitions in ALI Beydon L, et al. Inten Care Med 2002 Anatomic dead space increased slightly with PEEP Alveolar dead space did not vary systematically with PEEP In individual patients a decrease or increase of alveolar dead space paralleled a positive or negative response to PEEP in regards to oxygenation
VT 207 117 239 120 263 117 PIP / PEEP 25/6 24/12 40/12 15/8 40/12 17/10 Cdyn 11.1 9.6 8.6 18.5 9.6 17.3
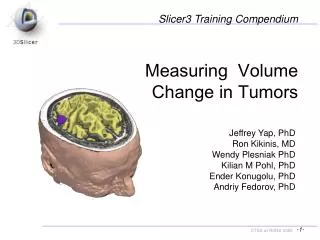
Lung protection and the open lung concept How to monitor at bedside? 1) PV-tools +/- 2) O2- + CO2-response 3) Chest CT and imaging methods? Gattinoni L AJRCCM 2001; 164:1701–1711
PA = 35 cmH2O PA = 15 cmH2O Information from CT studies: Lung heterogeneity and intratidal collapse and decollapse In heterogeneous lung injury inflation behaviour is heterogeneous Adapted from Suter P NEJM 1975; 292:284-289
CT to assure more homogenoeus lung volume distribution Barbas C Curr Opin Crit Care 2005;11:18–28 Barabs
normal poorly areated normal poorly areated CT-aeration - and how to detect overdistention? Diffuse CT-attenuations At ZEEP and 2 PEEP levels Focal CT-attenuations Rouby JJ AJRCCM 2002;165:1182-6
Volume distribution Frerichs I, Dargaville P, Rimensberger PC Intensive Care Med 2003; 29:2312-6 Electrical Impedance Tomography (EIT) Frerichs I et al. J Appl Physiol 2002; 93: 660–666
Volume distribution Tidal volume distribution Frerichs I, Dargaville P, Rimensberger PC Intensive Care Med 2003; 29:2312-6
EIT to assure more homogenoeus lung volume distribution Barbas C Curr Opin Crit Care 2005;11:18–28 Barabs
1. Assure gas transfer/exchange 2. Assure Vt-delivery (V-t / V-t / P-t curve characteristics) . To improve outcome Concepts of respiratory monitoring in the ICU Control system Diagnostic tool Biomechanical properties of lung and airways To improve understanding of lung disease and ventilator-patient interaction To avoid errors / incidents
From classical respiratory monitoring to tracking thoracic volume changes during ventilation maneuvers Flow-, Volume- and Pressure-measurements Pressure-volume methods: static vs. dynamic observe dynamic compliance changes Gas exchange response: pO2 and pCO2 Lung-Volume measurement methods: RIP, dilution methods, CT / MRI / EIT Tidal-volume distribution: EIT