Download
1 / 88
890 likes | 1.01k Vues
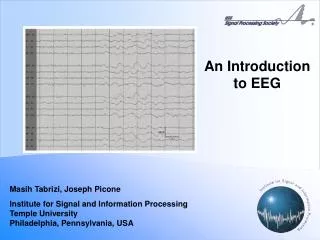
An Update on EEG Connectivity Metrics For Neurotherapists . Thomas F. Collura, Ph.D., QEEGT November 6, 2009. Current Issues. Resolve definition of metrics Associate metrics with function Use for assessment & diagnosis Use for training Use for evaluation of training results

E N D
An Update on EEG Connectivity Metrics For Neurotherapists Thomas F. Collura, Ph.D., QEEGT November 6, 2009 (c) 2009 Thomas F. Collura, Ph.D., QEEGT
Current Issues • Resolve definition of metrics • Associate metrics with function • Use for assessment & diagnosis • Use for training • Use for evaluation of training results • New insights re. function, disorders (c) 2009 Thomas F. Collura, Ph.D., QEEGT
The Purpose of Connectivity Training • To reflect whole brain function • Show relationship between two sites • Reflect amount of information shared • Reflect speed of information sharing • Real-time recording or postprocessed • Useful for assessing brain function • Useful for training brain connectivity • Takes us beyond amplitude training (c) 2009 Thomas F. Collura, Ph.D., QEEGT
Generalized Connectivity Model (c) 2009 Thomas F. Collura, Ph.D., QEEGT
System Identification and Parameter Estimation (c) 2009 Thomas F. Collura, Ph.D., QEEGT
Measurement Example - Temperature • We never measure “temperature” • We do observe: • Position of a column of mercury (“thermometer”) • Deflection of a bimetal strip (dial indicator) • Electrical potential (thermocouple) • Electrical resistance (thermistor) • Distribution of light energy (infrared spectrometry) • Color of a substance (“mood ring”) • Interpret in terms of a model & theory (c) 2009 Thomas F. Collura, Ph.D., QEEGT
Similarity ExampleHow similar are two people? • Do they speak the same language? • Can they wear the same clothing? • Can they eat the same food? • Can they use the same medicine? • Can they play the same instruments? • Do they enjoy the same music? • Do they practice the same religion? (c) 2009 Thomas F. Collura, Ph.D., QEEGT
Cortical Layers (c) 2009 Thomas F. Collura, Ph.D., QEEGT
Engineering Diagram of the Brain (c) 2009 Thomas F. Collura, Ph.D., QEEGT From interstitiality.net
Thalamo-Cortical Cycles (c) 2009 Thomas F. Collura, Ph.D., QEEGT
Concentration/Relaxation Cycle (c) 2009 Thomas F. Collura, Ph.D., QEEGT
Connectivity Measures • Many ways to measure connectivity • Always asking “how similar are the signals?” • Relative Phase sensitive or insensitive • Absolute phase sensitive or insensitive • Amplitude sensitive or insensitive • Measurement across time or across frequency • Source of raw data • Waveform • FFT • Digital Filter (IIR or FIR) or JTFA (c) 2009 Thomas F. Collura, Ph.D., QEEGT
Connectivity(coherence & phase) • Coherence: Amount of shared information • Phase: Speed of shared information • Thalamocortical • Theta, Alpha, SMR • Corticortical • Beta, Gamma • Intrahemispheric – e.g. language • Interhemispheric • Fronto-frontal – attention, control • occipito-parietal – sensory integration, aging (c) 2008 Thomas F. Collura, Ph.D. (c) 2009 Thomas F. Collura, Ph.D., QEEGT
Connectivity Measures - Summary • Pure Coherence (is relative phase stable?) • joint energy / product of self-energies • Synchrony Metric (do phase and amplitude match?) • Joint energy (real parts)/ sum of self-energies • Spectral Correlation Coefficient (FFT amplitudes same?) • Correlation (across frequency) between amplitude spectra • Comodulation (do components wax & wane together?) • Correlation (across time) between amplitude time-series • Asymmetry • Relative amplitude between two sites • Phase (is relative timing stable or same?) • Arctan of ratio of sin & cosine components • Sum & Difference Channels (arithmetic comparison) • Simply add or subtract raw waveforms (c) 2009 Thomas F. Collura, Ph.D., QEEGT
Connectivity Measures - Analogs • Pure Coherence • How much is information being shared? • Synchrony Metric • Are the sites locked together in time? • Spectral Correlation Coefficient • Are the “walkie-talkies” on the same wavelength? • Comodulation • Are the sites’ C/R cycles related to each other? • Asymmetry • Is there a balance/imbalance of activation? • Phase • How quickly is information being exchanged? • Sum & Difference Channels • How similar or different are the sites in exact activity? (c) 2009 Thomas F. Collura, Ph.D., QEEGT
Typical Ranges (c) 2009 Thomas F. Collura, Ph.D., QEEGT
Fz Cz (c) 2009 Thomas F. Collura, Ph.D., QEEGT
T3 T4 (c) 2009 Thomas F. Collura, Ph.D., QEEGT
F3 F4 (c) 2009 Thomas F. Collura, Ph.D., QEEGT
C3 C4 (c) 2009 Thomas F. Collura, Ph.D., QEEGT
O1 O2 (c) 2009 Thomas F. Collura, Ph.D., QEEGT
P3 P4 (c) 2009 Thomas F. Collura, Ph.D., QEEGT
Classical or “pure” Coherence • Measure of phase stability between two signals – gets “inside” signals • Wants them to be at the same frequency • Doesn’t care about absolute phase separation • Doesn’t care about relative amplitude • Measures of amount of shared information • Useful when sites have different timing • Can use FFT or JTFA to calculate (c) 2009 Thomas F. Collura, Ph.D., QEEGT
“Pure” Coherence • How stable is the phase relationship between the two? (c) 2009 Thomas F. Collura, Ph.D., QEEGT
Pure Coherence: BMr-NG Concordance (c) 2009 Thomas F. Collura, Ph.D., QEEGT
“Training” Coherence/Similarity(BrainMaster) • Similarity measure using Quad filters (JTFA) • Measure of phase and amplitude match between two signals – gets “inside” signals • Wants them to have zero phase separation • Wants them to have same amplitude • Useful for synchrony training • Random signals will have low similarity • Special case of coherence (“0 is a constant”) (c) 2009 Thomas F. Collura, Ph.D., QEEGT
Training Coherence (Similarity) • Are the two channels consistently in phase and of the same size? (c) 2009 Thomas F. Collura, Ph.D., QEEGT
Spectral Correlation Coefficient(Lexicor) • Measure of amplitude similarity in spectral energy – uses FFT amplitude data • Wants two signals to have similar power spectral shape • Completely ignores phase relationship • Meaningful for a single epoch • Random signals may have large correlation if spectra are similar (c) 2009 Thomas F. Collura, Ph.D., QEEGT
Spectral Correlation Coefficient (SCC/”Lexicor”) • How similar (symmetrical) is the shape of the spectral amplitude of the two channels in a particular band? (c) 2009 Thomas F. Collura, Ph.D., QEEGT
SCC: BMr – Lexicor Concordance(G, B, A, T, D; as of 1/12/07) (c) 2009 Thomas F. Collura, Ph.D., QEEGT
Comodulation(Sterman/Kaiser) • Measures similarity in amplitudes across time – classically uses FFT amplitude data • Correlation between envelopes of two signals • Completely ignores phase relationship • Must be considered across time epoch • Reflects how similarly signals wax and wane together • Can be computed using digital filters • Random signals will have low comodulation (c) 2009 Thomas F. Collura, Ph.D., QEEGT
Comodulation (SKIL) • How similar is the waxing and waning of the amplitudes? (c) 2009 Thomas F. Collura, Ph.D., QEEGT
Phase measurement • Various methods to compute • Attempts to extract phase relationship using mathematical technique • Stability and “wraparound” issues • FFT or Quad Digital Filters • Reflects how well signals line up in time • Measure of speed of information sharing • Useful for synchrony training (c) 2009 Thomas F. Collura, Ph.D., QEEGT
Phase • Exactly how well do the peaks and valleys line up? (c) 2009 Thomas F. Collura, Ph.D., QEEGT
Sum-channel • Adds two signals together in time domain • Gets “inside” signals • Peaks and valleys reinforce in time • Very sensitive to phase relationship • Wants signals to be in phase • Largest when both signals are large • Useful for synchrony training • Can uptrain coherence with sum-channel mode • Random signals: sum & difference will look the same (c) 2009 Thomas F. Collura, Ph.D., QEEGT
Difference-channel • Same as bipolar montage • Similar signals will cancel • Emphasizes differences • Useful for coherence downtraining • Cannot uptrain coherence with bipolar • Random (uncorrelated) signals: sum & difference signals will look the same (c) 2009 Thomas F. Collura, Ph.D., QEEGT
Channel Sum & Difference • The following animation shows the relationship between the phase of two signals and the amplitude of their sum and difference: • sumphase4.avi (c) 2009 Thomas F. Collura, Ph.D., QEEGT
Channel Sum & Difference (c) 2009 Thomas F. Collura, Ph.D., QEEGT
Ratio of Sum / Difference (c) 2009 Thomas F. Collura, Ph.D., QEEGT
Channel Recombination – BrainScape JTFAF3 and F4 (c) 2009 Thomas F. Collura, Ph.D., QEEGT
Channel Recombination – BrainScape JTFAC3 and C4 (c) 2009 Thomas F. Collura, Ph.D., QEEGT
Channel Recombination – BrainScape JTFAT3 and T4 (c) 2009 Thomas F. Collura, Ph.D., QEEGT
Channel Recombination – BrainScape JTFAO1 and O2 (c) 2009 Thomas F. Collura, Ph.D., QEEGT
Normal Distributionmales vs. females Photo by Gregory S. Pryor, Francis Marion University, Florence, SC. From: (C. Starr and R. Taggart. 2003. The Unity and Diversity of Life. 10th Ed. Page 189.) (c) 2008 Thomas F. Collura, Ph.D. (c) 2009 Thomas F. Collura, Ph.D., QEEGT
Live Z-Scores • Absolute Power (8 bands per channel) • Relative Power (8 bands per channel) • Power Ratios (10 ratios per channel) • Asymmetry (8 bands per path) • Coherence (8 bands per path) • Phase (8 bands per path) • Based on database of >600 subjects • Based on age, eyes open/closed (c) 2009 Thomas F. Collura, Ph.D., QEEGT
Live Z Scores – 2 channels (76 targets) 26 x 2 + 24 = 76 (52 power, 24 connectivity) (c) 2009 Thomas F. Collura, Ph.D., QEEGT
Live Z Scores – 4 channels (248 targets) 26 x 4 + 24 x 6 = 248 (104 power, 144 connectivity) (c) 2009 Thomas F. Collura, Ph.D., QEEGT
Z-Score Targeting Options • Train Z Score(s) up or down • Simple directional training • Train Z Score(s) using Rng() • Set size and location of target(s) • Train Z Score(s) using PercentZOK() • Set Width of Z Window via. PercentZOK(range) • Set Percent Floor as a threshold • Combine the above with other, e.g. power training (c) 2009 Thomas F. Collura, Ph.D., QEEGT
Choice of sites • Modular / Functional Approach (Walker et. al.) • Functional Hubs (Demos / Thatcher) • Symptom-based (Demos / Thatcher / Soutar / Brownback) • Choice of “boxes” (Stark / Lambos / Rutter) (c) 2009 Thomas F. Collura, Ph.D., QEEGT