Download
1 / 72
780 likes | 1.34k Vues
4.3 Digital Image Processing. Common image processing image analysis functions: A. Preprocessing B. Image Enhancement C. Image Transformation D. Image Classification and Analysis. Image Transformations. Manipulation of multiple bands of data Generates a ‘new’ image 1. 3 band combinations

E N D
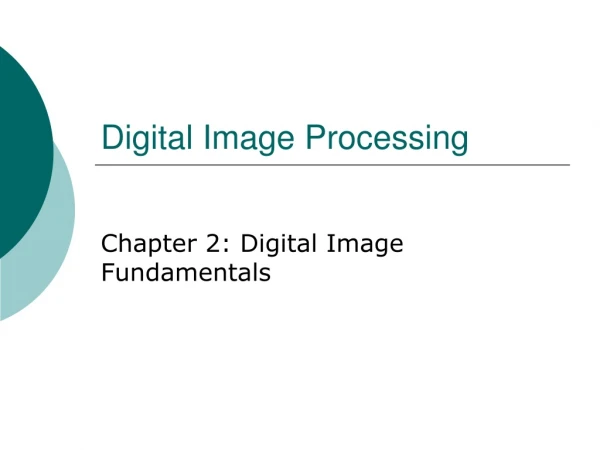
4.3 Digital Image Processing Common image processing image analysis functions: A. Preprocessing B. Image Enhancement C. Image Transformation D. Image Classification and Analysis
Image Transformations • Manipulation of multiple bands of data • Generates a ‘new’ image 1. 3 band combinations 2. Spectral ratioing(arithmetic operations) • vegetation indices • NDVI
1. 3 band combinations • Significant advantage of multi-spectral imagery is ability to detect important differences between surface materials by combining spectral bands. • Band combinations are created by combining bands of spectral data to enhance the particular land cover of interest.
Landsat Thematic Mapper Imagery Band Wavelength • 0.45 to 0.52 Blue Useful for distinguishing soil from vegetation. • 0.52 to 0.60 Green Useful for determining plant vigor. 3 0.63 to 0.69 Red Matches chlorophyll absorption-used for discriminating vegetation types. 4 0.76 to 0.90 Near IR Useful for determining biomass content. • 1.55 to 1.75 Short Wave IR Indicates moisture content of soil and veg. 6 10.40 to 12.50 Thermal IR. Geological mapping, soil moisture, Thermal pollution monitoring and ocean current studies. 7 2.08 to 2.35 Short Wave IR Ratios of 5 & 7 are used to map mineral deposits.
Near Infra Red Composite • Blue visible band is not used and the bands are shifted; • Visible greensensor band to the blue color gun • Visible red sensor band to the green color gun • NIR band to the red color gun. • Results in the familiar NIR composite with vegetation portrayed in red.
Near Infrared Composite (4,3,2) • Vegetation in NIR band is highly reflective • Shows veg in various shades of red • Water appears dark due to absorption
Popular band combination for vegetation studies, monitoring drainage and soil patterns and various stages of crop growth. • Vegetation - shades of red • Conifers darker red than hardwoods • lighter reds = grasslands or sparsely vegetated • Urban - cyan blue, light blue • Soils - dark to light browns. • Ice, snow and clouds - white or light cyan.
True Color composite Visible bands are selected and assigned to their corresponding color guns to obtain an image that approximates true color. Tends to appear flat and have low contrast due to scattering of the EM radiation in the blue visible region.
3, 2, 1 • Ground features appear in colors similar to their appearance • healthy veg = green • cleared fields = light • unhealthy veg = brown & yellow • roads = gray • shorelines = white • Water penetration - sediment and bathymetric info • Used for urban studies. • Cleared and sparsely vegetated areas are not as easily detected • Clouds and snow appear white and are difficult to distinguish.
Bands 7,4,2 In a SWIR composite, sensor band 7 is selected from the short-wave infrared region.
Shortwave Infrared Composite (7,4,3 or 7,4,2) • SWIR composite image contains at least one shortwave infrared (SWIR) band. • Reflectance in SWIR region due primarily to moisture • SWIR bands are especially suited for camouflage detection, change detection, disturbed soils, soil type, and vegetation stress.
Provides a "natural-like" view, penetrates atmospheric particles and smoke. • Healthy veg = bright green • Barren soil = Pink • Sparse veg = oranges and browns • Dry veg = orange • Water = blue • Sands, soils and minerals - multitude of colors. • Fires = red - used in fire management • Urban areas = magenta • Grasslands - light green. • Conifers being darker green than deciduous • Provides striking imagery for desert regions • Useful for geological, agricultural and wetland studies
Use the spectral profile tool (Raster Profile Tool) to examine the different spectral properties of a. water, b. vegetation and c. urban areas. Choose several pixels from each of the 3 categories and plot them. Water Blue Green Red Near IR
Agriculture Blue Green Red Near IR
Urban Blue Green Red Near IR
2. Spectral ratioing - Using vegetation indices such as NDVI to study vegetation
Chlorophyll - Amount of chlorophyll in leaves affects the spectral signature in the visible. • Cells known as ‘spongy mesophyll’ are responsible for reflection of NIR. • Reflection occurs where the walls of these cells meet with air spaces inside the leaf.
Chlorophyll in healthy vegetation absorbs most of visible red and blue for photosynthesis. • Amount of near infrared energy reflected is a function of • internal structure • amount of moisture
Vegetation in imagery • Multispectral imagery valuable for study of vegetation. • Distinct appearance in certain spectral bands • Distinguishes it from other objects in landscape. • Spectral signature varies with species and envir. factors • ID plants in various stages of life cycle or states of health. • Large areas can be studied quickly. • Esp. useful in remote areas (tropical rainforest) • Possible to obtain accurate quantitative information from imagery, together with field data.
Vegetation in imagery Examples; • Est. # of acres of forest harvested for timber. • Predict regional or global yields of crops (wheat, soybeans) • Est. quantity of phytoplankton in oceans.
Healthy vegetation - high reflectance in NIR & low reflectance in red.
Landsat Thematic Mapper Imagery Band Wavelength 1 0.45 to 0.52 Blue 2 0.52 to 0.60 Green 3 0.63 to 0.69 Red 4 0.76 to 0.90 Near IR 5 1.55 to 1.75 Short Wave IR 6 10.40 to 12.50 Thermal IR. 7 2.08 to 2.35 Short Wave IR
Sometimes air spaces can be filled with water, thus a plant's state of hydration can significantly affect the reflectance in NIR. • Different species have different leaf cell structures, which affects reflectance of NIR. • Related factors – leaf size and orientation also affect reflectance of NIR. • For example, broad, thin leaves of deciduous plants are more reflective than needles of coniferous trees.
Most NIR that is not reflected by leaves is transmitted. • provides info to analyst • In a dense forest canopy, leaves underneath often reflect the energy transmitted by the top layer of leaves. • So, sections of a forest with a dense canopy will exhibit higher DN values in the near infrared band than sections with sparse canopy.
Differences among plant species; • amounts of chlorophyll • different leaf structures, shapes or orientation • causes species to absorb, reflect, or transmit differently. • Veg. may have different spectral signature when it is; • Emergent • Mature • Undergoing normal seasonal changes • Dormant • Healthy veg. contains more chl. than stressed or diseased. • Variations in spectral sigs. can be used to study vegetation through image interpretation.
When leaves lose their chlorophyll in autumn their spectral characteristics change. • Deciduous more reflective in NIR than conifers.
false-color composite - brightest red near river, indicating most vigorous vegetation, may be deciduous trees, shrubs, and grass. darker red regions surrounding are coniferous forest.
Vegetative index - calculated (or derived) from remotely-sensed data to quantify vegetative cover on Earth's surface. • Normalized Difference Vegetative Index (NDVI) most widely used.
Ratio between measured reflectivity in red and near infrared. • Gives info on absorption of chlorophyll in leafy green vegetation and density of green vegetation on the surface. • Also, contrast between vegetation and soil is at a maximum.
Normalized Difference Vegetation Index (NDVI)has been in use for many years to measure and monitor plant growth (vigor), vegetation cover, and biomass production from multispectral satellite data.
NDVI is calculated from the visible and near-infrared light reflected by vegetation. Healthy vegetation (left) absorbs most of the visible light that hits it, and reflects a large portion of the near-infrared light. Unhealthy or sparse vegetation (right) reflects more visible light and less near-infrared light. The numbers on the figure above are representative of actual values, but real vegetation is much more varied.
NDVI computed as ratio of red and near infrared (NIR) spectral bands : • NDVI = (NIR - red) / (NIR + red) • Resulting index value is sensitive to presence of vegetation on land surfaces and used to address vegetation type, amount, and condition. • Advanced Very High Resolution Radiometer (AVHRR). • used to generate NDVI images of large portions of Earth on regular basis to provide global images that portray seasonal and annual changes to vegetative cover. • Thematic Mapper (TM and Enhanced Thematic Mapper Plus (ETM+) bands 3 and 4 also provides Red and NIR measurements: • NDVI = (Band 4 - Band 3) / (Band 4 + Band 3)
Primary differences between AVHRR and Landsat NDVI is resolution. • AVHRR resolution is 1km and NDVI is 8 km • Landsat NDVI resolution is 30 m • AVHRR data - frequent global NDVI products • Landsat 7 ETM+ data - greater detail covering less area.
NDVI equation produces values in the range of -1.0 to 1.0, where vegetated areas will typically have values greater than zero and negative values indicate non-vegetated surface features such as water, barren, ice, snow, or clouds.
Erdas: Create NDVI Index NDVI -1.0 to 1.0 Black values = -0.30 Whites values = 0.44
D. Image Classification and Analysis • Process of categorizing all pixels in an image into land cover classes. • Multispectral imagery is used. • Spectral Signatures for each pixel is the numerical basis for the algorithm.
Continuous data • Raster data that are quantitative (measuring a characteristic) and have related, continuous values, such as remotely sensed images (e.g., Landsat, SPOT). Thematic data • Raster data that are qualitative and categorical. • Classes of related information, such as land cover, soil type, slope.
Image data classification • Primary component of image interpretation • using computer software to spectrally categorize data • computer id’s clusters of spectrally similar pixels • Analyst's knowledge • how to classify the image data • assign appropriate descriptions to the categories • Individual pixels in a continuous image are assigned to classes. • Result is a thematic image where each class represents a feature type in the real world.
Create thematic image from multi-spectral continuous image Classes DN Values
unsupervised - analyst may have little knowledge of what data represents. supervised - a priori knowledge required.
Each pixel in image contains information about the surface materials that reflected light from that pixel to the sensor. Each pixel contains a value which can range from 0 to 255, for each band in image.
Vegetation - Features that are indistinguishable in visible region of EMS can be separated in near IR. NIR VIS
Supervised and Unsupervised Classification • Two different approaches to classifying an image • Each has advantages and disadvantages • Unsupervised classification • primarily a computer process • minimal user input • analyst assigns an identification to each class, based on knowledge of the image's content
Supervised classification • user-controlled process • depends on knowledge and skills of analyst for accurate results. • analyst knows beforehand what feature classes are present and where each is in one or more locations within scene. • Used to train computer to find spectrally similar areas.
Unsupervised classification - used to generate a set of classes for entire image and make a preliminary interpretation. • Then supervised classification can be used to redefine the classes as more information becomes available.