Download
1 / 4
110 likes | 524 Vues
Objective 4: Probability. Tree Diagrams. What is a tree diagram ?. Tree diagrams are a way to draw out different possible outcomes A tree diagram helps us figure out the sample space for an event. When do we use tree diagrams ?.

E N D
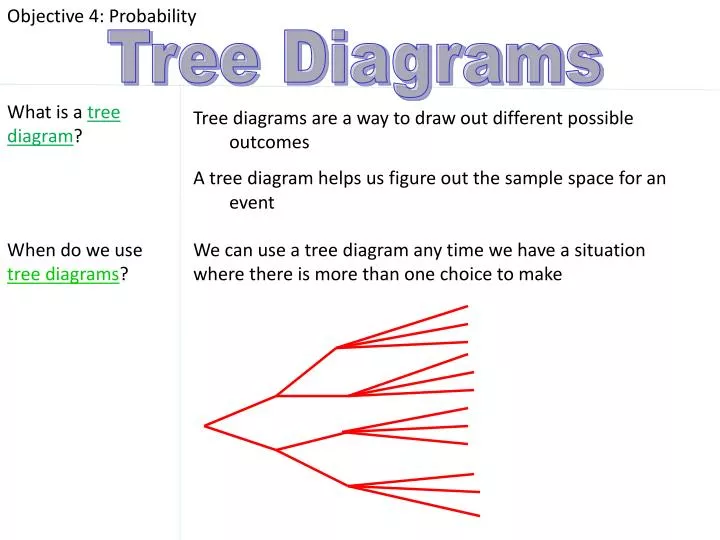
Objective 4: Probability Tree Diagrams What is a tree diagram? Tree diagrams are a way to draw out different possible outcomes A tree diagram helps us figure out the sample space for an event When do we use tree diagrams? We can use a tree diagram any time we have a situation where there is more than one choice to make
Objective 4: Probability Tree Diagrams Example At the ice cream shop, you can get chocolate or vanilla ice cream, a regular cone or a waffle cone, and hot fudge or rainbow sprinkles. How many different ways can you order your ice cream? Hot Fudge Rainbow Hot Fudge Rainbow Hot Fudge Rainbow Hot Fudge Rainbow Regular Waffle Regular Waffle Chocolate Vanilla
Objective 4: Probability Tree Diagrams Example Now, write out each different combination: Hot Fudge Choc/Reg/Fudge Rainbow Choc/Reg/Rainbow Hot Fudge Choc/Waffle/Fudge Rainbow Choc/Waffle/Rainbow Hot Fudge Van/Reg/Fudge Rainbow Van/Reg/Rainbow Hot Fudge Van/Waffle/Fudge Rainbow Van/Waffle/Rainbow Hot Fudge Rainbow Hot Fudge Rainbow Hot Fudge Rainbow Hot Fudge Rainbow Regular Waffle Regular Waffle Chocolate Vanilla
Objective 4: Probability Tree Diagrams Is there a shortcut for figuring out the number of possibilities without drawing a tree diagram? YES!!! If you have more than one choice to make, just multiply the number of each option together Ice cream example: 2 flavors x 2 cones x 2 toppings = 8 choices Example 2: I have 5 shirts, 4 pairs of pants, and 3 pairs of shoes. How many different outfits can I make? 5 x 4 x 3 = 60 different outfits