Download
1 / 14
140 likes | 228 Vues
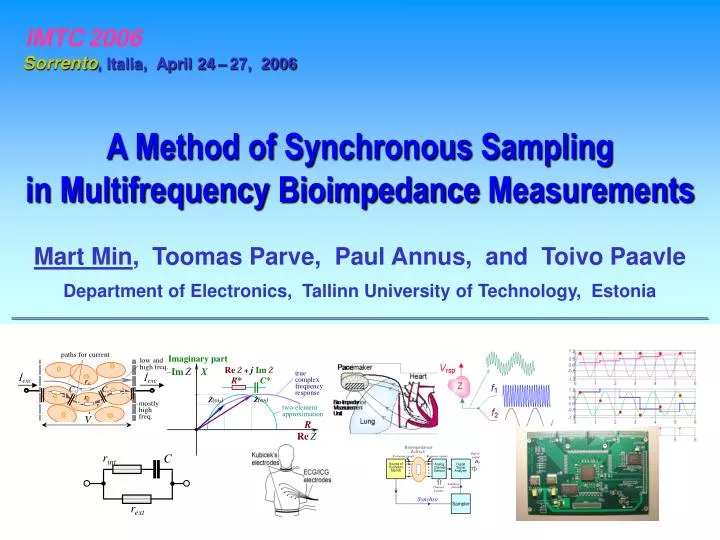
IMTC 2006 Sorrento , Italia, April 24 – 27, 2006 A Method of Synchronous Sampling in Multifrequency Bioimpedance Measurements Mart Min , Toomas Parve, Paul Annus, and Toivo Paavle Department of Electronics, Tallinn University of Technology, Estonia

E N D
IMTC2006 Sorrento, Italia, April 24–27, 2006 A Method of Synchronous Sampling in Multifrequency Bioimpedance Measurements Mart Min, Toomas Parve, Paul Annus, and Toivo Paavle Department of Electronics, Tallinn University of Technology, Estonia _______________________________________________________________________________________ rint C rext
IMTC2006, Sorrento 2 Mart Min, et al. A Method of Synchronous Sampling in Multifrequency Bioimpedance Measurement Simultaneous multichannel and multifrequency measurements Why multichannel ? Why multifrequency ? Why simultaneous ? Examples of electrical bio-impedance (EBI) measurement in cardiology. a) b) c) d) noninvasive plethysmography multielectrode invasive estimation of the ventricular volume intracardiac impedance based pacing control biomodulation
IMTC2006, Sorrento 3 Mart Min, et al. A Method of Synchronous Sampling in Multifrequency Bioimpedance Measurement rint C rext Electrical Bioimpedance (EBI) What is specific in the bioimpedance (EBI) ? a) Essentials of the EBI b) The 3-element equivalent of the static EBI c) The phasor diagram of the static EBI Fig.1. The essentials of the EBI (a), the 3-element equivalent of the static EBI (b), and the phasor diagram (c) of the static EBI for two frequencies, low ωl and high ωh. Frequency response of the EBI Ż(f) is also called impedance spectrum.
IMTC2006, Sorrento 4 Mart Min, et al. A Method of Synchronous Sampling in Multifrequency Bioimpedance Measurement Re+ Im– Im+ Re– fsampling =4·fsignal EBI measurement using synchronous sampling The direct current component DC can be determined as DC =(Re+ + Re–) ∕2 or DC =(Im++Im–)∕ 2 The real Re and imaginary Im parts of the phasor Ż are determined as Re = (Re+ – Re–)∕ 2 and Im = (Im+ – Im–)∕ 2 Fig. 2. Synchronous sampling of a single sine wave response. Real part samples Re+ are designated as filled red dots●and Re–as unfilled red ones ○, imaginary part samples Im+ asfilled green squares ■, and Im– as unfilled green squares □
IMTC2006, Sorrento 5 Mart Min, et al. A Method of Synchronous Sampling in Multifrequency Bioimpedance Measurement Two typical cases of measurement multisite multifrequency non-uniform synchronous sampling a) Two different impedances are measured b) The same impedance is measured at a slightly differing frequency at (two) essentially different frequencies Fig. 3. Simultaneous measurement of responses to two excitations Note: Only the Re+ samples are shown for the response signal.
IMTC2006, Sorrento 6 Mart Min, et al. A Method of Synchronous Sampling in Multifrequency Bioimpedance Measurement f1 f2 fSP,1 =f1 f2 f1 fSP,2 =f2 fSP 6 A1= ΣAi ⁄6 i=1 6 ΣAi = 0 i=1 5 A2= ΣAi ⁄5 i=1 5 ΣAi = 0 i=1 non-uniform sampling Why to use the non-uniform sampling at simultaneous measurement? f1⁄f2 = 6 ⁄ 5 tmeas = 6 ⁄f1 = 5 ⁄f2 Fig.3. Simultaneous measurement of the responses to two excitations with different frequencies f1 and f2
IMTC2006, Sorrento 7 Mart Min, et al. A Method of Synchronous Sampling in Multifrequency Bioimpedance Measurement 6 A1= ΣSi ⁄6 i=1 11 A2= ΣSi ⁄5 i=7 f1 f2 fSP 11 ΣSi = 0 i=7 6 ΣSi = 0 i=1 fSP,1 fSP,2 Piecewise uniform synchronous sampling at sequential measurements (time division mode) f1⁄f2 = 6 ⁄ 5 tmeas = 12 ⁄f1 = 12·T1 , where T1 = 1 ⁄f1
IMTC2006, Sorrento 8 Mart Min, et al. A Method of Synchronous Sampling in Multifrequency Bioimpedance Measurement Time division mode measurement with channel multiplexing Synchrois important !
IMTC2006, Sorrento 9 Mart Min, et al. A Method of Synchronous Sampling in Multifrequency Bioimpedance Measurement Ch 1 Ch 2 Ch 1 Ch 2 45˚ 45˚ Measurement in time division mode with channel multiplexing Fig.5. Re+ sampling moments for two input channels and two frequencies in each: first f1 is measured in both channels one by other (red samples), then f2 is measured (green samples) in the same way (time division mode).
IMTC2006, Sorrento 10 Mart Min, et al. A Method of Synchronous Sampling in Multifrequency Bioimpedance Measurement Digitizing and Digital Processing of Response Signal
IMTC2006, Sorrento 11 Mart Min, et al. A Method of Synchronous Sampling in Multifrequency Bioimpedance Measurement Design example The modular arrangement is based on the Field Programmable Gate Array (FPGA) Spartan™-3 (Xilinx). The FPGA ● selects channels, ● generates sampling pulses, ● controls gain, ● generates excitation and compensation codes, ● reads samples from digityzers (ADCs), ● performs math functions, and ● provides communication with the outside world. Fig.6. The FPGA based DSP unit: block diagram with I/O connectionsand peripherial components Fig.7. A photo of the prototyped DSP unit
IMTC2006, Sorrento 12 Mart Min, et al. A Method of Synchronous Sampling in Multifrequency Bioimpedance Measurement The Measurement Unit The bio-modulation istypically about 1%, frequently 0.01% (100µV peak-to-peak). 1) The multiplexed response signal is sampled and digitized by ADC1. 2) The digital samples are converted back to analog signals using DAC1. 3) The output of DAC1 is subtracted from the response signal, the resultgained128 times(gives 7 additional bits), and digitized by ADC2. Fig.8. Functional diagram of the bioimpedance measurement unit
IMTC2006, Sorrento 13 Mart Min, et al. A Method of Synchronous Sampling in Multifrequency Bioimpedance Measurement 1299 1298 Additive noise plus 1 Hz triangularmodulation 100 µVp- to-p 1299 0.5 mV 1 LSB = 7.7 µV 1298 1 Hz triangular modulation 100 µVp- to- p 1299 100 µVp- to- p 0.5 mV 1298 1 Hz triangular modulation 100 µVp- to- ptime t Experimental results Fig.9. Output code of the 12-bit ADC1, LSB=488 µV Fig. 9 shows variations of output code of the ADC1. A 0.01% triangular amplitude modulation (100µVpeak-to-peakvalue) of 2Vpeak-to-peak carrier was used for testing. 0.01% of carrier "1299" Fig.10. Output code of the 12-bit ADC2, LSB=7.7 µV "1298" Fig.11. Digital “raw” signal stored in the FPGA
IMTC2006, Sorrento 14 Mart Min, et al. A Method of Synchronous Sampling in Multifrequency Bioimpedance Measurement Conclusions The designed bioimpedance measurement unit is qualified for multichannel noninvasive diagnosing of cardiovascular system (impedance cardiograph ICG), but can find much wider use. The method ensures fast and precise digital signal processing, enabling to demodulate 0.01% bio-modulation of carrier signals up to 1 MHz and higher frequencies. Thank you for your attention ! ______________________________________________________ C o n t a c t Prof.Mart Min, Department of Electronics, Tallinn University of Technology, Phone: +372 6202156, Fax: +372 6202151, Email: min@edu.ttu.ee Ehitayate tee 5, 19086 Tallinn, Estonia