Download
1 / 20
200 likes | 348 Vues
Courtesy: Zach Allen. A New Hampshire Ground-Level Ozone Pollution Forecasting Tool Using Meteorological Criteria. 2008 November 5. Northeast Regional Operational Workshop Presenter: Laura Landry, Plymouth State University. Introduction.

E N D
Courtesy: Zach Allen A New Hampshire Ground-Level Ozone Pollution Forecasting Tool Using Meteorological Criteria 2008 November 5 Northeast Regional Operational Workshop Presenter: Laura Landry, Plymouth State University
Introduction • New Hampshire Department of Environmental Services (NHDES) has forecasted ozone pollution for over 15 years • Ozone exposure causes a wide range of respiratory problems (AIRNow 2008) • Primarily concerned with Environmental Protection Agency’s (EPA) National Ambient Air Quality Standard (NAAQS) for ozone • Based on daily maximum 8-hour average ozone concentration
Introduction • Since March 2008, a new NAAQS for ozone has been implemented, lowered from 84ppb to 75ppb • Previously used forecasting methods have become less accurate • Motivation: To develop a new forecasting guide for predicting the new standard of 75ppb • Results will help answer questions of: • How much variation in meteorological criteria will there be between air monitoring sites? • How will criteria compare when using two different time periods of data?
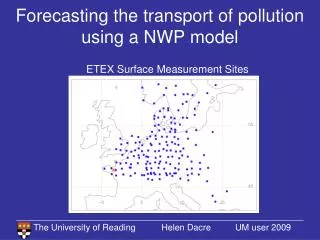
Introduction • Meteorological conditions behind ozone development • Sunny skies • High surface temperatures • Calm to light winds • Transport of pollution • New Hampshire lies downwind of major pollution sources
Methodology • Selection of air quality monitoring sites • Sites were selected base on: • Locations where most exceedance days occur • More problematic to forecast • Larger sample size on which to base the analysis • Locations not adjacent to each other
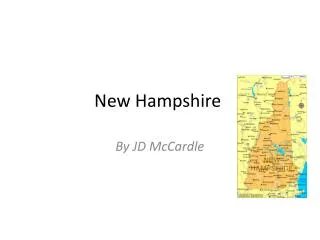
Methodology • Southern sites report most of exceedance days • Site elevations range from 0 to 150m • Miller State Park is an exception at about 700m New Hampshire
Methodology • Previous research conducted by Jeffs (2007), a Master’s thesis at Plymouth State University • Created an ozone forecasting guide for 65ppb • Utilized a dataset from 2002-2005 • This study followed similar methodology • EPA suggests an air quality climatology as about 4 years (EPA 1999) • Used two datasets of June-August • 2004-2007 • 2002-2007
Methodology • Ozone data • Daily maximum 8-hour average ozone concentration • Source: NHDES • Meteorological data • Surface observations from KCON, KEEN, KASH, KPSM, and Miller State Park • Source: National Weather Service, Plymouth State University, NHDES • Radiosonde data from KGYX • Source: Plymouth State University
Methodology • Analysis was done using the Criteria Method • EPA-recommended method for creating air quality forecast guides (EPA 1999) • Subjective analysis that focuses on exceedance days • Determines threshold values
Methodology • Meteorological parameters: • Daily maximum surface temperature • 850hPa temperature (12 UTC) • Surface wind speed and direction (12 & 18 UTC) • Cloud cover (12 & 18 UTC) • Times were chosen based on: • 12 UTC: morning conditions prior to a potential high ozone event • 18 UTC: afternoon conditions when ozone typically reaches its daily maximum value
Results • Comparing criteria of air monitoring site to site… • Daily observations • Maximum surface temperature: ≥ 83˚F • 12 UTC observations • 850hPa temperature: ≥ 12˚C • Surface wind speed: ≤ 5 knots • Surface wind direction: Southwesterly to southerly • Cloud cover: ≤ FEW
Results • Comparing criteria of air monitoring site to site… • 18 UTC observations • Surface wind speed: ≤10 knots • Surface wind direction: Westerly to southwesterly • Cloud cover: ≤ SCT • Results from Miller State Park varied most from all other sites
Site to Site Comparison Miller State Park Nashua
Results • Comparing criteria among different time periods of data among the same air monitoring site…
Dataset Comparison Portsmouth
Summary • This study developed an ozone forecasting guide for the NHDES • The criteria method from the EPA • Subjectively analyzed meteorological threshold values • Threshold values indicate a high probability of an exceedance day
Conclusions • Air monitoring site to site comparison: • Similar threshold values among sites • Miller State Park appeared to be an outlier • Could be due to high elevation • Transport may be more of an issue • Dataset to dataset comparison: • No significant variation in threshold values • In this study, the length of the dataset did not have a large effect on results
Questions? References: • AIRNow, accessed 2008: Ozone and Your Health. [http://www.airnow.gov/index.cfm?action= static.ozone2] • EPA, 1999: Guideline for Developing an Ozone Forecasting Program. EPA: Office of Air Quality Planning and Standards. • Jeffs, Kim, 2007: Development of Meteorological Criteria for Forecasting Air Quality in New Hampshire. Plymouth State University: Master of Science Thesis Project.