Download
1 / 29
300 likes | 433 Vues
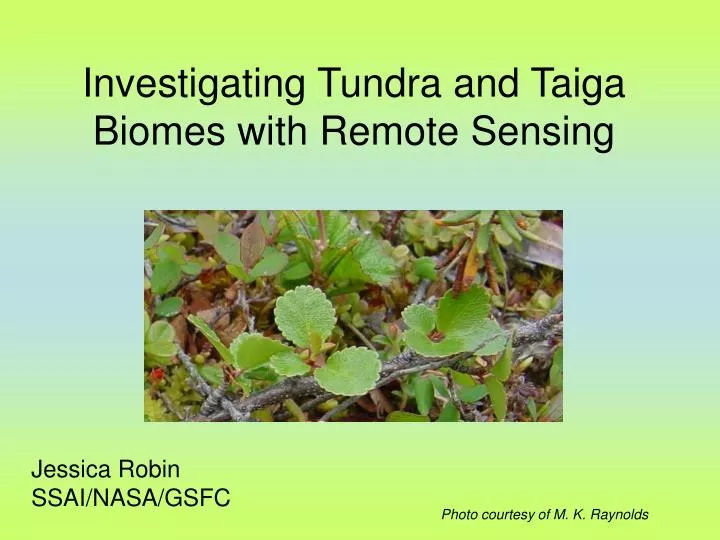
Investigating Tundra and Taiga Biomes with Remote Sensing. Jessica Robin SSAI/NASA/GSFC. Photo courtesy of M. K. Raynolds. Photo – M. K. Raynolds. Outline of presentation. Climate change and arctic vegetation Remote sensing research Field research by Martha Reynolds (UAF)

E N D
Investigating Tundra and Taiga Biomes with Remote Sensing Jessica Robin SSAI/NASA/GSFC Photo courtesy of M. K. Raynolds
Photo – M. K. Raynolds Outline of presentation • Climate change and arctic vegetation • Remote sensing research • Field research by Martha Reynolds (UAF) • Research with GLOBE data
Arctic Temperatures (1966-1995) Image courtesy of National Snow & Ice Center
2001 temperatures compared to 1950 to 1981 “normal” temperatures Image courtesy of Goddard Institute of Space Science
Northern Greening (1981-1999) Image courtesy of Liming Zhou, Boston University
Photo – D. A. Walker Arctic Climate Impact Assessment Report put out in 2004 by the Arctic Council and the International Arctic Science Committee (IASC)International panel The summary report, graphics and detailed scientific report can be found on the web at: http://www.acia.uaf.edu/
Key Findings of the ACIA regarding vegetation Arctic vegetation zones are very likely to shift causing wide-ranging impacts. • Treeline is expected to move northward and to higher elevations, with forest replacing a significant fraction of existing tundra, and tundra vegetation moving into polar deserts. • More productive vegetation is likely to increase carbon uptake, although reduced reflectivity of the land is likely to outweigh this, causing further warming. • Disturbances such as insect outbreaks and forest fires are very likely to increase in frequency, severity and duration, facilitating invasion by non-native species. • Where suitable soils are present, agriculture will have the potential to expand northward due to a longer and warmer growing season.
1991 1992 1993 Goetz et al. 2005 summary of 1981-2003 trends in AVHRR NDVI Strong Positive Positive Near Zero Negative Strong Negative 1994 1995 1996 1997 1998 1999 High Low Time-integrated NDVI Jia and Epstein Recent studies have shown increases in satellite-sensed indices (NDVI) of circumpolar tundra vegetation. NDVI of boreal forests shows decreasing trends.
The spring season has started earlier and max NDVI has increased • NDVI trends for the forested and tundra regions, broken down by six-year intervals. • The forested areas show a recent decline in the maximum NDVI. • Tundra regions have shown a continued increase in NDVI and a marked 10-day shift toward earlier onset of greening. • There is no corresponding shift in the cessation of the greening period. 10% increase in NDVI 10-day spring shift in growing season length Goetz et al. 2005. PNAS,102: 13521-13525
(Sturm et al. 2001) Changes in arctic shrubs
Yukon Flats National Wildlife Refuge, Riordan et al. 2006 JGR Shrinking lakes due to warmer temperatures leading to changes in permafrost and more evaporation affects vegetation.
Community changes in ITEX experiment after 6 years • Satellite data show changes • Greenhouse warming experiments show changes • but very few studies have been able to document changes occurring to undisturbed tundra Open-top chamber Control
Current research by Martha K. Raynolds University of Alaska Fairbanks • Trying to measure existing tundra vegetation conditions in enough detail and in enough places that future changes due to climate change can be measured.
Greenland Arctic tundra bioclimate subzones
a – mosses, liverworts and lichens, b – forbs, c – prostrate dwarf-shrubs, d – non-tussock graminoids, e -hemiprostrate dwarf shrubs, f – erect dwarf shrubs, g – low shrubs, h – tussock graminoids • Plant physiognomy occurring in different Tundra Bioclimate Subzones • A – mosses, liverworts and lichens with some grasses and forbs • B – rushes and prostrate dwarf shrubs with mosses, liverworts and lichens • C – hemiprostrate and prostrate dwarf shrubs with bryophytes and lichens • D – sedges, erect and prostrated dwarf shrubs with bryophytes and lichens • E – tussock sedges, low and erect dwarf shrubs with bryophytes and lichens
Landscapes of the Tundra Bioclimate Zone Subzone A A = coldest E = warmest N Subzone B No shrubs Erect dwarf shrubs Hummocks Mounds Tussocks Subzone C Subzone D S Subzone E
Monitoring vegetation phenology with GLOBE Data • Satellite data from the past two decades shows a corresponding increase in growing season in northern latitudes (Myneni, R.B., Keeling, C.D., Tucker, C.J., Asrar, G., and Nemani, R.R., 1997, Increased plant growth in the northern high latitudes from 1981 to 1991, Nature, 386:698-702.) • However, minimal on-ground observations of plant phenology exist to validate such satellite findings
OBJECTIVES • Analyze the efficacy of phenology monitoring using GLOBE and satellite derived vegetation indices from AVHRR and MODIS data • Compare AVHRR and MODIS data
GLOBE SCHOOLS 10 Schools Elementary-High School Public, Charter, Private, Home Anchorage area (3) Fairbanks area (7) Lat: 61.17° – 64.85° N Lon: 147.52°-149.41° W
FIELDMEASUREMENTS Birch • Students made observations & measurements (2001-2004) • budburst, green-up, leaf growth & green down • research focused on budburst and green-up • Trees/Shrubs: Betula, Populus, Salix (Viereck, Leslie, A. and Little, Elbert L. Jr. 1972. Alaska Trees and Shrubs. Agriculture Handbook No. 410. Forest Service, USDA, Washington D.C) Poplar Willow GLOBE Students, Alaska Photo courtesy of Cheryl Pratt and Elena Sparrow, U of Alaska Fairbanks
SATELLITE DATA AVHRR • Advanced Very High Resolution Radiometer • On board NOAA’s POES(Polar Orbiting Environmental Satellites) since 1979 • Research includes NDVI data for Fairbanks and Anchorage regions from 2001 - 2004
SATELLITE DATA MODIS • Moderate Resolution Imaging Spectroradiometer • On board Terra – Earth Observing System (EOS) • Terra satellite launched in 1999 • This research includes NDVI data for Fairbanks and Anchorage regions from 2001 - 2004
Conclusions • Different processing and spectral characteristics restrict continuity between AVHRR and MODIS NDVI datasets • NDVI has limitations in boreal regions due to snow, large extent of conifers, and clouds