Download
1 / 1
30 likes | 190 Vues
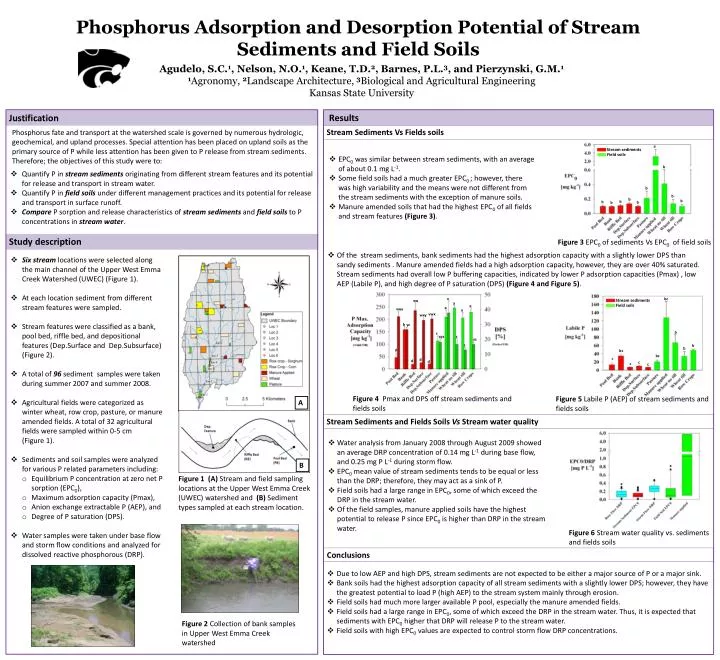
Agudelo, S.C. 1 , Nelson, N.O. 1 , Keane, T.D. 2 , Barnes, P.L. 3 , and Pierzynski, G.M. 1 1 Agronomy, 2 Landscape Architecture, 3 Biological and Agricultural Engineering Kansas State University. Results. Justification. Stream Sediments Vs Fields soils.

E N D
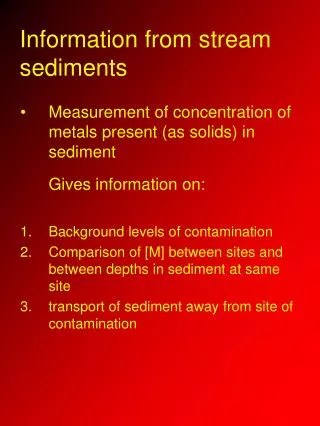
Agudelo, S.C.1, Nelson, N.O.1, Keane, T.D.2, Barnes, P.L.3, and Pierzynski, G.M.1 1Agronomy, 2Landscape Architecture, 3Biological and Agricultural Engineering Kansas State University Results Justification Stream Sediments Vs Fields soils Phosphorus fate and transport at the watershed scale is governed by numerous hydrologic, geochemical, and upland processes. Special attention has been placed on upland soils as the primary source of P while less attention has been given to P release from stream sediments. Therefore; the objectives of this study were to: a Stream sediments Stream sediments • EPC0 was similar between stream sediments, with an average of about 0.1 mg L-1. • Some field soils had a much greater EPC0 ; however, there was high variability and the means were not different from the stream sediments with the exception of manure soils. • Manure amended soils that had the highest EPC0 of all fields and stream features (Figure 3). Field soils Field soils b • Quantify P in stream sediments originating from different stream features and its potential for release and transport in stream water. • Quantify P in field soils under different management practices and its potential for release and transport in surface runoff. • Compare P sorption and release characteristics of stream sediments and field soils to P concentrations in stream water. b b b b b b b b Phosphorus Adsorption and Desorption Potential of Stream Sediments and Field Soils Study description Figure 3 EPC0 of sediments Vs EPC0 of field soils • Of the stream sediments, bank sediments had the highest adsorption capacity with a slightly lower DPS than sandy sediments . Manure amended fields had a high adsorption capacity, however, they are over 40% saturated. Stream sediments had overall low P buffering capacities, indicated by lower P adsorption capacities (Pmax) , low AEP (Labile P), and high degree of P saturation (DPS) (Figure 4 and Figure 5). • Six stream locations were selected along the main channel of the Upper West Emma Creek Watershed (UWEC) (Figure 1). • At each location sediment from different stream features were sampled. • Stream features were classified as a bank, pool bed, riffle bed, and depositional features (Dep.Surface and Dep.Subsurface) (Figure 2). • A total of 96 sediment samples were taken during summer 2007 and summer 2008. • Agricultural fields were categorized as winter wheat, row crop, pasture, or manure amended fields. A total of 32 agricultural fields were sampled within 0-5 cm (Figure 1). • Sediments and soil samples were analyzed for various P related parameters including: • Equilibrium P concentration at zero net P sorption (EPC0), • Maximum adsorption capacity (Pmax), • Anion exchange extractable P (AEP), and • Degree of P saturation (DPS). • Water samples were taken under base flow and storm flow conditions and analyzed for dissolved reactive phosphorous (DRP). v vw bc a a a vwx a vwx wxy b yz c xyz z b yz z b d b bc d d d bc c c c c Figure 4 Pmax and DPS off stream sediments and fields soils Figure 5 Labile P (AEP) of stream sediments and fields soils A Stream Sediments and Fields Soils Vs Stream water quality • Water analysis from January 2008 through August 2009 showed an average DRP concentration of 0.14 mg L-1 during base flow, and 0.25 mg P L-1 during storm flow. • EPC0 mean value of stream sediments tends to be equal or less than the DRP; therefore, they may act as a sink of P. • Field soils had a large range in EPC0, some of which exceed the DRP in the stream water. • Of the field samples, manure applied soils have the highest potential to release P since EPC0 is higher than DRP in the stream water. B Figure 1 (A) Stream and field sampling locations at the Upper West Emma Creek (UWEC) watershed and (B) Sediment types sampled at each stream location. Figure 6Stream water quality vs. sediments and fields soils Conclusions • Due to low AEP and high DPS, stream sediments are not expected to be either a major source of P or a major sink. • Bank soils had the highest adsorption capacity of all stream sediments with a slightly lower DPS; however, they have the greatest potential to load P (high AEP) to the stream system mainly through erosion. • Field soils had much more larger available P pool, especially the manure amended fields. • Field soils had a large range in EPC0, some of which exceed the DRP in the stream water. Thus, it is expected that sediments with EPC0 higher that DRP will release P to the stream water. • Field soils with high EPC0 values are expected to control storm flow DRP concentrations. Figure 2 Collection of bank samples in Upper West Emma Creek watershed