Download
1 / 13
130 likes | 321 Vues
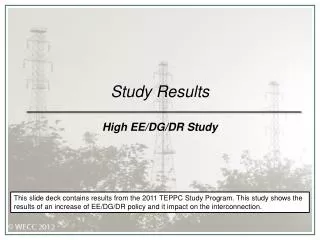
Study Results High Hydro Study Low Hydro Study. This slide deck contains results from the 2011 TEPPC Study Program. This study shows the impacts of low and high hydro conditions on generation, transmission, and production cost . . 2022 PC1-1 High Hydro Sensitivity.

E N D
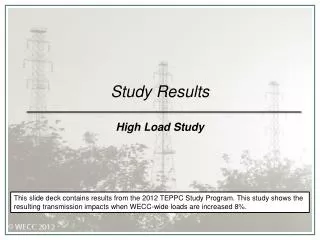
Study ResultsHigh Hydro StudyLow Hydro Study This slide deck contains results from the 2011 TEPPC Study Program. This study shows the impacts of low and high hydro conditions on generation, transmission, and production cost.
2022 PC1-1 High Hydro Sensitivity • Central Question: How does production cost, generation dispatch, and transmission utilization change under low hydro conditions? • Change to starting input assumptions: • Loads – none • Transmission System – None • Generation – 2011 hydro data substituted for median hydro data (2005) • Results follow…
2022 High Hydro Results – Changes in Total Annual Generation GWh
2022 High Hydro Results – Changes in Region-Region Transfers
2022 High Hydro Results – Changes in Transmission Utilization Most Heavily Utilized Paths Increases in U90 Relative to Common >5% Case Indicated in Red P01 Alberta-British Columbia P03 Northwest-British Columbia P08 Montana to Northwest P11 West of Crossover P10 West of Colstrip P65 PDCI *NEW* P66 COI *NEW* P16 Idaho-Sierra *NEW* P29 Intermountain-Gonder P27 IPP DC Line P60 Inyo-Control P26 Northern-Southern California P47 – Southern New Mexico P45 SDG&E-CFE
2022 PC1-2 Low Hydro Sensitivity • Central Question: How does production cost, generation dispatch, and transmission utilization change under low hydro conditions? • Change to starting input assumptions: • Loads – none • Transmission System – None • Generation – 2001 hydro data substituted for median hydro data (2005) • Results follow…
Single coincident year selected, except for BC Modeled data for a dry year provided by BC Hydro Year selection based on overall WECC-wide low hydro conditions Selection of Low Hydro Year
2022 Low Hydro Results – Changes in Total Annual Generation (MWh) GWh
2022 Low Hydro Results – Changes in Transmission Utilization Most Heavily Utilized Paths Increases in U90 Relative to Common >5% Case Indicated in Red P01 Alberta-British Columbia P03 Northwest-British Columbia P08 Montana to Northwest P11 West of Crossover P10 West of Colstrip P29 Intermountain-Gonder P27 IPP DC Line P60 Inyo-Control P26 Northern-Southern California P47 – Southern New Mexico P45 SDG&E-CFE