Download
1 / 15
160 likes | 411 Vues
The IS-LM Model An Introductory Overview. Outline. Review of Goods and Money Market Equilibrium (Keynesian Model) The IS-LM Model (Extended Model) Derivation of IS-LM Curves Shift in IS-LM Curves IS and LM Curves Together (Goods and money market equilibrium) Policy Implication.

E N D
The IS-LM Model An Introductory Overview
Outline • Review of Goods and Money Market Equilibrium (Keynesian Model) • The IS-LM Model (Extended Model) • Derivation of IS-LM Curves • Shift in IS-LM Curves • IS and LM Curves Together (Goods and money market equilibrium) • Policy Implication
The Keynesian theory of income/output determination assumes interest rate as given and proceeds from there • Similarly, in the money market equilibrium, it proceeds from the given level of income • But, the rise in investment also puts pressures on the • interest rate, that ultimately discourages investment and the actual rise in the equilibrium level of income is less than it would otherwise be • The IS-LM model can explain this phenomena and determines Y and r simultaneously Review of Good and Money Market
Derivation of IS Curve S S S’ S y I I I’ r r I r r’ S y I y y’ I’ I
AD Alternatively, The IS curve is the locus of various combinations of Y and r that clear the goods market. C+I1 C+I A higher r leads to low I which means, through multiplier, a low Y. y y1 r r Viewed from income side, a low Y means low S. As equilibrium requires I=S, a low S implies low I which is the result of high r. r1 IS Curve y y y1
IS Curve (contd.) Equation of IS curve: Y = C (Y-T) + I (Y,r) + G …………(1) Rearranging eq (1) in the simplest form, Y = C (Y) + I (r) + G……………….(2) Differentiating equation (2), we have dY = c’dY+I’dr I’dr = (1-c’)dY dr/dY = (1-c’)/I’ Since 1-c’ > 0, I’ < 0, dr/dY <0 This implies that IS curve is negatively slopped. In other words, the goods market equilibrium implies that output is a decreasing function of interest rate.
The IS Curve (contd.) The change in the factors affecting the demand for goods/services (i.e. government spending, private investment, tax, consumers’/investors’ confidence etc.) will shift the IS curve in or out. y What are the factors leading to the leftward (inward) shift of IS curve? IS2 IS1 r 0
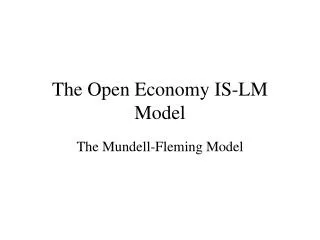
Derivation of LM Curve The money demand function: Md = f (y,r), f’(y) > 0, f’(r) <0 Md = ky + hr Ms = m, assumed to be exogenously determined For money market equilibrium, Ms = Md m = ky + hr……………(3) ms r r2 md2 at y2 r1 The rate of interest is determined, in the money market, by the intersection of demand for and supply of money md1 at y1 0 md,ms m
mdt mdt mdt1 mdt2 Differentiating equation (3), dm = k’dy + h’dr 0 = k’dy + h’dr dr/dy = - k’/h’, since k’>0 and h’<0 dr/dy > 0 This implies that the LM curve is positively slopped. y mds M L y mds 0 0 mds1 mds2
The LM curve is the locus of the combinations of Y and r that clears the money market The LM Curve (contd.) HIGHER ECONOMIC ACTIVITIES PUT PRESSURE ON THE INTEREST RATE r Equilibrium in the money market implies that the higher the level of income/output, the higher the demand for money, and therefore higher the equilibrium level of interest rate Due to changes in Ms ms r y 0 Alternative method of derivation of LM Curve LM r2 md2 at y2 r1 md1 at y1 0 md,ms y1 y2 m
Goods and Money Market Equilibrium LM r The goods and money market equilibrium at point e with re rate of interest and ye level of income e re IS y 0 ye LM
Shift in IS and LM Curves r LM2 LM LM1 e2 e2 r2 e1 r2 e1 r1 r1 IS2 IS1 IS1 0 0 y2 ye1 y2 ye1
Shift r LM2 LM LM1 e2 e2 r2 e1 r2 e1 r1 r1 IS2 IS1 IS1 0 0 y2 ye1 y2 ye1
Suppose the macro-model of an economy is given as follows: Consumption function C = 100+0.75Yd Investment function I = 250 – 4r Government spending G = 150 Tax function T = 40 + 0.20Y Transfer payments Tr = 40 Transaction money demand Mt = 0.25Y Speculative money demand Msp = -20r Nominal money supply Ms = 1000 Price level P = 5 (where ,Yd is disposable income, Y is income in Rs. Billion and r is interest rate,%) • Compute equilibrium income and interest rate. • Find the crowding out effect if government spending increases by Rs. 50 billion. • Also find the effect of increase in tax rate from 0.20Y to 0.25Y.
Exercise Using IS-LM model, analyze the effect of • expansionary fiscal policy • contractionary fiscal policy • expansionary monetary policy • contractionary monetary policy • monetary-fiscal policy mix, on the level of y and r • Consider the following Keynesian Model, where • Y = C + I + G Md = kY – mr • C = Co + b(Y-T) Ms = Ko • I = Io - vr Md = Ms • T = tY • G = Go • Where, b = 0.8, t = 0.2, v = 18, m = 12, k = 0.3, Co = 70, Io = 282, Go = 241, Ko = 250 • Find the equilibrium rate of interest (r) and level of income (y). • What is the new value of money supply (Ms) which the monetary authority must attain in order to ensure the income level of 1230?