Download
1 / 36
390 likes | 827 Vues
Ali El Battay (Dr.) Yap Tsong Shiuan Kamaruzaman SIJAM (Dr.) Mazlan HASHIM (Prof. Dr.). PROACTIVE APPROACH TO USE HYPERSPECTRAL REMOTE SENSING FOR CROP BIOTIC STRESS DETECTION. Significance. PROACTIVE APPROACH TO USE HYPERSPECTRAL REMOTE SENSING FOR CROP BIOTIC STRESS DETECTION

E N D
Ali El Battay (Dr.) Yap TsongShiuan Kamaruzaman SIJAM (Dr.) Mazlan HASHIM (Prof. Dr.) PROACTIVE APPROACH TO USE HYPERSPECTRAL REMOTE SENSING FOR CROP BIOTIC STRESS DETECTION
Significance PROACTIVE APPROACH TO USE HYPERSPECTRAL REMOTE SENSING FOR CROP BIOTIC STRESS DETECTION • “proactive” means controlling a situation by causing something to happen rather than waiting to respond to it after it happens. RS data are the mirror of what happened on Earth surface. • Using PRS, the change detected in RS data are deliberately induced and the Earth surface is intentionally modified in such a way that the electromagnetic signal reflects new information inaccessible by conventional RS techniques.
Significance (cont’d) • Early detection and treatment of cash crop diseases can prevent unnecessary losses and significantly increase crop yield • The induced spectral response will aid in early detection of cash crop diseases through synchronization of remote sensing data acquisition with the routine farming practices and/or environmental fluctuations
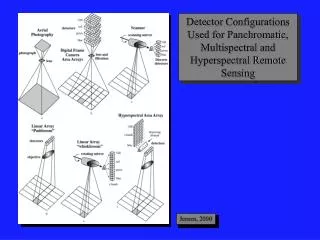
Detection of vegetation biotic stress Conventional methods Remote sensing Thermology Detect transpiration Passive Sensitive to environment Chlorophyll fluorescence imaging Chlorophyll efficiency Artificial illumination Reflectance imaging Satellite or airborne platform Expensive • Visual Approach • Requires years of knowledge and experience • Time consuming • Labour intensive • Difference in perception among individuals
Objectives • To prove the occurrence of pre-symptom stage (spectral) of ralstonia solanacearum infection in cucumber plant • To determine the possibility of inducing a measurable spectral change by using nutrient, light exposure and water stress during the pre-symptom stage
Scope • Crop Type: Cucumber (Cucumis sativus L.) • Pathogen: Ralstonia solanacearum (Bacterial Wilt) • Stimuli: Nutrient content, water content, light exposure
Cucumber (CucumisSativus) • Cucumber (CucumisSativus L.) is one of the most widely produced vegetable in the world. • An annual, creeping herb, up to 5 m long • It is grown for the immature fruits which are used as a salad vegetable, pickles and sometimes boiled in stews
RalstoniaSolanacearum • A gram-negative, plant pathogenic, soil bacterium • The cause of bacterial wilt in a very wide range of potential host plants • Common crop hosts are:potatoes, tomatoes, aubergine, banana, geranium, ginger, tobacco, sweet peppers, olive, etc. • Transmission is through contaminated:tools, machinery, handlers, water, soil and seed
Symptoms • Severe rapid wilting of leaves • Chlorotic or stunted with adventitious roots on the stem • Glistening beads of dark gray slimy ooze from the infected xylem in stem cross sections • Bacterial streaming of fine, milky white strands from xylem vessels occurs when stems are cut and placed in water
Inoculated cucumber under normal condition Non-inoculated cucumber under normal optimal conditions Inoculated cucumber + manipulated nutrient Non-inoculated cucumber + manipulated nutrient Inoculated cucumber + manipulated light exposure Non-inoculated cucumber + manipulated light exposure Non-inoculated cucumber + manipulated water content Inoculated cucumber + manipulated water content Spectroradiometer measurement Determination of pre-symptom stage of ralstonia solanacearum in cucumber Quantitative estimation using vegetation indices Detection of spectral signature changes in the pre-symptom stage Flow Chart
Non-inoculated Seed Inoculated Seed Water Stress Backup Backup Water Stress Normal Condition Normal Condition Light Stress Nutrient Stress Nutrient Stress Light Stress Design
Data capture • ASD FieldSpecPro Spectroradiometer connected to the Panasonic Toughbook. • (b) Fiberoptic attached to pistol grip with 8˚ foreoptic.
Data Collection • White reference • Dark current • Raw DN (10 times) • Constant lighting • Constant angle • Accompanying image and notes θ
Objectives (reminder) • To prove the occurrence of pre-symptom stage (spectral) of ralstonia solanacearum infection in cucumber plant • To determine the possibility of inducing a measurable spectral change by using nutrient, light exposure and water stress during the pre-symptom stage
Normal Condition Nutrient Stress Non-inoculated Inoculated Non-inoculated Inoculated Water Stress Light Stress Non-inoculated Inoculated Inoculated Non-inoculated
Conclusion • The occurrence of pre-symptom spectral stage of ralstoniasolanacearuminfection in cucumber plant has been proven, and last at least 10 days in this experimental conditions. • There is a possibility of inducing a measurable spectral change by reducing light exposure (-5 hours) during the spectral pre-symptom stage. MCARI and NRI vegetation indices respond to this induced EM-Spectral change.
Future Work • Understanding! • Modeling and Generalization! • Implementation feasibility? • . • . • . • Monetising!
Thank You Dino, Yap and Amanda Questions?