Download
1 / 1
10 likes | 85 Vues
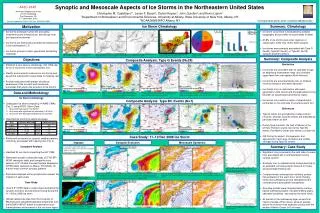
Climatological Aspects of Freezing Rain in the Eastern United States. P.1.39. Christopher M. Castellano 1 *, Lance F. Bosart 1 , Daniel Keyser 1 , and John Quinlan 2 1 University at Albany, State University of New York 2 NOAA/NWS/WFO Albany, NY. American Meteorological Society

E N D
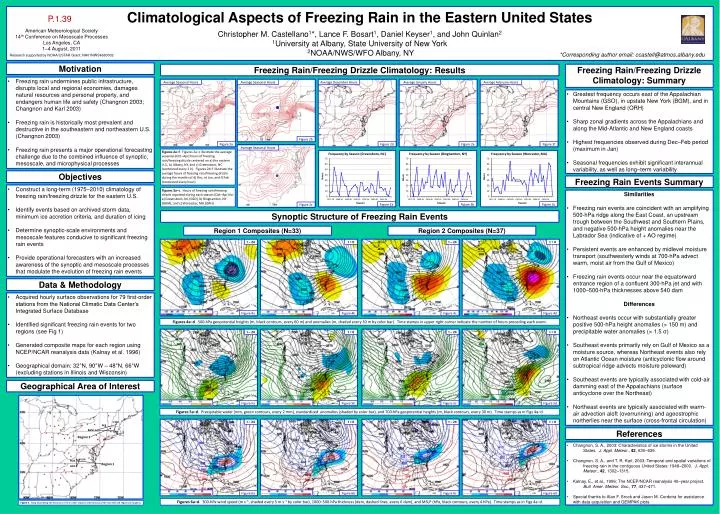
Climatological Aspects of Freezing Rain in the Eastern United States P.1.39 Christopher M. Castellano1*, Lance F. Bosart1, Daniel Keyser1, and John Quinlan2 1University at Albany, State University of New York 2NOAA/NWS/WFO Albany, NY American Meteorological Society 14th Conference on Mesoscale Processes Los Angeles, CA 1–4 August, 2011 Research supported by NOAA/CSTAR Grant: NA01NWS4680002 *Corresponding author email: ccastell@atmos.albany.edu Motivation Freezing Rain/Freezing Drizzle Climatology: Summary Freezing Rain/Freezing Drizzle Climatology: Results • Freezing rain undermines public infrastructure, disrupts local and regional economies, damages natural resources and personal property, and endangers human life and safety (Changnon 2003; Changnon and Karl 2003) • Freezing rain is historically most prevalent and destructive in the southeastern and northeastern U.S. (Changnon 2003) • Freezing rain presents a major operational forecasting challenge due to the combined influence of synoptic, mesoscale, and microphysical processes Average Seasonal Hours Average Seasonal Hours Average December Hours Average January Hours Average February Hours • Greatest frequency occurs east of the Appalachian Mountains (GSO), in upstate New York (BGM), and in central New England (ORH) • Sharp zonal gradients across the Appalachians and along the Mid-Atlantic and New England coasts • Highest frequencies observed during Dec–Feb period (maximum in Jan) • Seasonal frequencies exhibit significant interannual variability, as well as long–term variability Figure 2b Figure 2a Figure 2d Figure 2e Figure 2f Average Seasonal Hours Figures 2a–f. Figures 2a–c illustrate the average seasonal (Oct–Apr) hours of freezing rain/freezing drizzle centered on a) the eastern U.S., b) Albany, NY, and c) Greensboro, NC (contoured every 2 h). Figures 2d–f illustrate the average hours of freezing rain/freezing drizzle during the months of d) Dec, e) Jan, and f) Feb (contoured every hour). Objectives Freezing Rain Events Summary DATA MISSING • Construct a long-term (1975–2010) climatology of freezing rain/freezing drizzle for the eastern U.S. • Identify events based on archived storm data, minimum ice accretion criteria, and duration of icing • Determine synoptic-scale environments and mesoscale features conducive to significant freezing rain events • Provide operational forecasters with an increased awareness of the synoptic and mesoscale processes that modulate the evolution of freezing rain events Figures 3a–c. Hours of freezing rain/freezing drizzle reported during each season (Oct–Apr) for a) Greensboro, NC (GSO), b) Binghamton, NY (BGM), and c) Worcester, MA (ORH). • Similarities • Freezing rain events are coincident with an amplifying 500-hPa ridge along the East Coast, an upstream trough between the Southwest and Southern Plains, and negative 500-hPa height anomalies near the Labrador Sea (indicative of + AO regime) • Persistent events are enhanced by midlevel moisture transport (southwesterly winds at 700-hPa advect warm, moist air from the Gulf of Mexico) • Freezing rain events occur near the equatorward entrance region of a confluent 300-hPa jet and with 1000–500-hPa thicknesses above 540 dam • Differences • Northeast events occur with substantially greater positive 500-hPa height anomalies (> 150 m) and precipitable water anomalies (> 1.5 σ) • Southeast events primarily rely on Gulf of Mexico as a moisture source, whereas Northeast events also rely on Atlantic Ocean moisture (anticyclonic flow around subtropical ridge advects moisture poleward) • Southeast events are typically associated with cold-air damming east of the Appalachians (surface anticyclone over the Northeast) • Northeast events are typically associated with warm-air advection aloft (overrunning) and ageostrophic northerlies near the surface (cross-frontal circulation) Figure 3a Figure 3b Figure 3c Figure 2c Synoptic Structure of Freezing Rain Events Region 1 Composites (N=33) Region 2 Composites (N=37) t – 24 t = 0 t – 24 t = 0 Data & Methodology • Acquired hourly surface observations for 79 first-order stations from the National Climatic Data Center’s Integrated Surface Database • Identified significant freezing rain events for two regions (see Fig 1) • Generated composite maps for each region using NCEP/NCAR reanalysis data (Kalnay et al. 1996) • Geographical domain: 32°N, 90°W – 48°N, 66°W (excluding stations in Illinois and Wisconsin) Figure 4a Figure 4b Figure 4c Figure 4d Figures 4a–d. 500-hPa geopotential heights (m, black contours, every 60 m) and anomalies (m, shaded every 30 m by color bar). Time stamps in upper right corner indicate the number of hours preceding each event. t – 24 t = 0 t – 24 t = 0 Geographical Area of Interest Figure 5a Figure 5b Figure 5c Figure 5d Figures 5a–d. Precipitable water (mm, green contours, every 2 mm), standardized anomalies (shaded by color bar), and 700-hPa geopotential heights (m, black contours, every 30 m). Time stamps as in Figs 4a–d. t – 24 t = 0 t – 24 t = 0 CON ALB BGM References ORH Region 2 • Changnon, S. A., 2003: Characteristics of ice storms in the United • States. J. Appl. Meteor., 42, 630–639. • Changnon, S. A., and T. R. Karl, 2003: Temporal and spatial variations of • freezing rain in the contiguous United States: 1948–2000. J. Appl. • Meteor., 42, 1302–1315. • Kalnay, E., et al., 1996: The NCEP/NCAR reanalysis 40–year project. • Bull. Amer. Meteor. Soc., 77, 437–471. • Special thanks to Alan F. Srock and Jason M. Cordeira for assistance with data acquisition and GEMPAK plots LYH ROA Region 1 GSO Figure 6a Figure 6b Figure 6c Figure 6d Figures 6a–d. 300-hPa wind speed (m s−1, shaded every 5 m s−1 by color bar), 1000–500-hPa thickness (dam, dashed lines, every 6 dam), and MSLP (hPa, black contours, every 4 hPa). Time stamps as in Figs 4a–d. Figure 1. Map illustrating the locations of first-order stations (red dots) and the two defined regions (triangles).