Download
1 / 25
270 likes | 953 Vues
Scoring Matrices. June 18, 2003 Comments on Workshop #3 Writing assignments due July 7 1 pm. Learning objectives- Understand how scoring matrices are constructed. Review of Dotter software program.

E N D
Scoring Matrices • June 18, 2003 • Comments on Workshop #3 • Writing assignments due July 7 1 pm. • Learning objectives- Understand how scoring matrices are constructed. Review of Dotter software program. • Workshop-Import sequences of interest from GenBank, place in FASTA format, align sequences using DOTTER program.
Global Alignment vs. Local Alignment Global Needleman-Wuncsh Method Local Dotter Smith-Waterman FastA BLAST
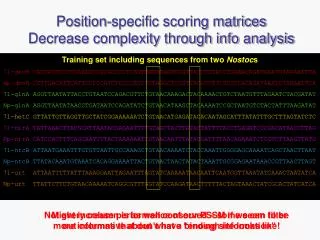
Scoring Matrices • Importance of scoring matrices • Scoring matrices appear in all analyses involving sequence comparisons. • The choice of matrix can strongly influence the outcome of the analysis. • Scoring matrices implicitly represent a particular theory of relationships. • Understanding theories underlying a given scoring matrix can aid in making proper choice.
Scoring Matrices When we consider scoring matrices, we encounter the convention that matrices have numeric indices corresponding to the rows and columns of the matrix. For example, M11 refers to the entry at the first row and the first column. In general, Mij refers to the entry at the ith row and the jth column. To use this for sequence alignment, we simply associate a numeric value to each letter in the alphabet of the sequence. For example, if the matrix is: {A,C,T,G} then A = 1, C = 2, etc. Thus, one would find the score for a match between A and C at M12.
Two major scoring matrices for amino acid sequence comparisons • PAM-derived from sequences known to be closely related (Eg. Chimpanzee and human). Ranges from PAM1 to PAM500 • BLOSUM-derived from sequences not closely related (Eg. E. coli and human). Ranges from BLOSUM 10-BLOSUM 100
1) It implies that each amino acid (AA) mutates independently of each other with a probability which depends only on the AA. Since there are 20 AA, the transition probabilities are described by a 20X20-mutation matrix, denoted by M. A standard M, which defines a 1-PAM change. Point Accepted Mutation (PAM) Distance: A 1-PAM unit changes 1% of the amino acids on average: where fi is the frequency of AAi, and Mii is the frequency of no change in amino acid i. The Point-Accepted-Mutation (PAM) model of evolution and the PAM scoring matrix
The Point-Accepted-Mutation (PAM) model of evolution and the PAM scoring matrix • Started by Margaret Dayhoff, 1978 • A series of matrices describing the extent to which two amino acids have been interchanged in evolution • PAM-1 was obtained by aligning very similar sequences. Other PAMs were obtained by extrapolation
The Point-Accepted-Mutation (PAM) model of evolution and the PAM scoring matrix A 2-PAM unit is equivalent to two 1-PAM unit evolution (or M2). A k-PAM unit is equivalent to k 1-PAM unit evolution (or Mk). Example 1: CNGTTDQVDKIVKILNEGQIASTDVVEVVVSPPYVFLPVVKSQLRPEIQV |||||||||||||| ||||||||||||||||||||||||||||||||||| CNGTTDQVDKIVKIRNEGQIASTDVVEVVVSPPYVFLPVVKSQLRPEIQV length = 50 1 mismatch PAM distance = 2
The Point-Accepted-Mutation (PAM) model of evolution and the PAM scoring matrix Observed % Sequence Difference Evolutionary Distance In PAMs 1 5 10 20 40 50 60 70 80 1 5 11 23 56 80 112 159 246
Analyze Pam10 and Pam500 scoring matrices. Describe differences between the two matrices and the logic behind the differences.
Assumptions in the PAM model 1. Replacement at any site depends only on the amino acid at that site and the probability given by the table (Markov model). 2. Sequences that are being compared have average amino acid composition.
Steps to building the first PAM • Aligned sequences that were at least 85% identical. • Reconstructed phylogenetic trees and inferred ancestral sequences. 71 trees containing 1,572 aa exchanges were used. • Tallied aa replacements "accepted" by natural selection, in all pairwise comparisons (each Aij is the number of times amino acid j was replaced by amino acid i in all comparisons).
Steps to building PAM (cont. 1) 4. Computed amino acid “mutability”, mj (the propensity of a given amino acid, j, to be replaced by any other amino acid) 5. Combined data from 3 & 4 to produce a Mutation Probability Matrix for one PAM of evolutionary distance, according to the following formula: Replacements
Steps to building PAM (cont. 2) 6. Take the log odds ratio to obtain each score: Sij = log (Mij/fi) Where fi is the normalized frequency of aai in the sequences used. 7. Note: must multiply the Mij/fi by a factor of 10 prior to avoid fractions.
Sources of error in PAM model 1. Many sequences depart from average aa composition. 2. Rare replacements were observed too infrequently to determine probabilities accurately (for 36 aa pairs (out of 400 aa pairs) no replacements were observed!). 3. Errors in 1 PAM are magnified when extrapolated to 250 PAM. (Mijk = k PAM) 4. The idea that each amino acid is acting independently is an imperfect representation of evolution. Actually, distantly related sequences usually have islands (blocks) of conserved residues implying that replacement is not equally probable over entire sequence.
The bottom line on PAM Frequency of alignment Frequency of occurrence The probability that two amino acids, i and j are aligned by evolutionary descent divided by the probability that they are aligned by chance
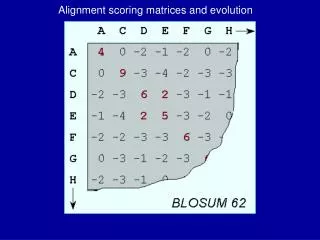
BLOSUM Matrix (BLOcks SUbstitution Matrices) • Blocks Sum-created from BLOCKS database • A series of matrices describing the extent to which two amino acids are interchangeable in conserved structures of proteins • The number in the series represents the threshold percent similarity between sequences, for consideration for calculation (Eg. BLOSUM62 means 62% of the aa’s were similar)
BLOSUM Matrices • BLOSUM is built from distantly related sequences within conserved blocks whereas PAM is built from closely related sequences • BLOSUM is built from conserved blocks of aligned protein segments found in the BLOCKS database (the BLOCKS database is a secondary database that depends on the PROSITE Family database)
BLOSUM Matrices (cont.1) • Version 8.0 of the Blocks Database consists of 2884 blocks based on 770 protein families documented in PROSITE. PROSITE supplies documentation for each family. Hypothetical entry in red box in BLOCK record: AABCDA...BBCDA DABCDA.A.BBCBB BBBCDABA.BCCAA AAACDAC.DCBCDB CCBADAB.DBBDCC AAACAA...BBCCC
Building BLOSUM Matrices 1. To build the BLOSUM 62 matrix one must eliminate sequences that are identical in more than 62% of their amino acid sequences. This is done by either removing sequences from the Block or by finding a cluster of similar sequences and replacing it with a single representative sequence. 2. Next, the probability for a pair of amino acids to be in the same column is calculated. In the previous page this would be the probability of replacement of A with A, A with B, A with C, and B with C. This gives the value qij 3. Next, one calculates the probability that a certain amino acid frequency exists, fi.
Building BLOSUM Matrices (cont.) 4. Finally, we calculate the log odds ratio si,j= log2 (qij/fi). This value is entered into the matrix. Which BLOSUM to use? BLOSUM Identity 80 80% 62 62% (usually default value) 35 35% If you are comparing sequences that are very similar, use BLOSUM 80. Sequences that are more divergent (dissimilar) than 20% are given very low scores in this matrix.
The Dotter Program • Program consists of three components: • Sliding window • A table that gives a score for each amino acid match • A graph that converts the score to a dot of certain density. • The higher the density the higher the score.
PAM-1 BLOSUM-100 Small evolutionary distance High identity within short sequences Which Scoring Matrix to use? PAM-250 BLOSUM-20 • Large evolutionary distance • Low identity within long sequences
FASTA format >gi|1244762|gb|AAA98563.1| p53 tumor suppressor homolog MSQGTSPNSQETFNLLWDSLEQVTANEYTQIHERGVGYEYHEAEPDQTSLEISAYRIAQPDPYGRSESYD LLNPIINQIPAPMPIADTQNNPLVNHCPYEDMPVSSTPYSPHDHVQSPQPSVPSNIKYPGEYVFEMSFAQ PSKETKSTTWTYSEKLDKLYVRMATTCPVRFKTARPPPSGCQIRAMPIYMKPEHVQEVVKRCPNHATAKE HNEKHPAPLHIVRCEHKLAKYHEDKYSGRQSVLIPHEMPQAGSEWVVNLYQFMCLGSCVGGPNRRPIQLV FTLEKDNQVLGRRAVEVRICACPGRDRKADEKASLVSKPPSPKKNGFPQRSLVLTNDITKITPKKRKIDD ECFTLKVRGRENYEILCKLRDIMELAARIPEAERLLYKQERQAPIGRLTSLPSSSSNGSQDGSRSSTAFS TSDSSQVNSSQNNTQMVNGQVPHEEETPVTKCEPTENTIAQWLTKLGLQAYIDNFQQKGLHNMFQLDEFT LEDLQSMRIGTGHRNKIWKSLLDYRRLLSSGTESQALQHAASNASTLSVGSQNSYCPGFYEVTRYTYKHT ISYL